
 Yahoo Finance
 Marley Spoon Group SE (ETR:MS1): Are Analysts Optimistic?
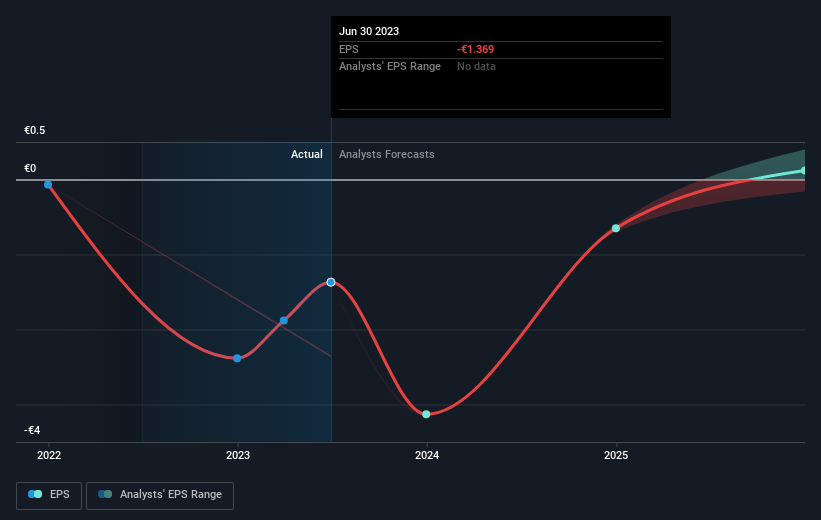
Marley Spoon Group SE (ETR:MS1) is possibly approaching a major achievement in its business, so we would like to shine some light on the company. Marley Spoon Group SE, through its subsidiary, Marley Spoon SE, operates as a direct-to-consumer (DTC) meal-kit company. The €81m market-cap company’s loss lessened since it announced a €13m loss in the full financial year, compared to the latest trailing-twelve-month loss of €7.2m, as it approaches breakeven. Many investors are wondering about the rate at which Marley Spoon Group will turn a profit, with the big question being “when will the company breakeven?” We've put together a brief outline of industry analyst expectations for the company, its year of breakeven and its implied growth rate.
See our latest analysis for Marley Spoon Group
Consensus from 2 of the German Hospitality analysts is that Marley Spoon Group is on the verge of breakeven. They anticipate the company to incur a final loss in 2024, before generating positive profits of €1.3m in 2025. So, the company is predicted to breakeven just over a year from today. In order to meet this breakeven date, we calculated the rate at which the company must grow year-on-year. It turns out an average annual growth rate of 64% is expected, which is extremely buoyant. Should the business grow at a slower rate, it will become profitable at a later date than expected.
We're not going to go through company-specific developments for Marley Spoon Group given that this is a high-level summary, but, take into account that generally a high forecast growth rate is not unusual for a company that is currently undergoing an investment period.
One thing we would like to bring into light with Marley Spoon Group is it currently has negative equity on its balance sheet. This can sometimes arise from accounting methods used to deal with accumulated losses from prior years, which are viewed as liabilities carried forward until it cancels out in the future. These losses tend to occur only on paper, however, in other cases it can be forewarning.
Next Steps:
This article is not intended to be a comprehensive analysis on Marley Spoon Group, so if you are interested in understanding the company at a deeper level, take a look at Marley Spoon Group's company page on Simply Wall St. We've also compiled a list of essential aspects you should look at:
Valuation: What is Marley Spoon Group worth today? Has the future growth potential already been factored into the price? The intrinsic value infographic in our free research report helps visualize whether Marley Spoon Group is currently mispriced by the market.
Management Team: An experienced management team on the helm increases our confidence in the business – take a look at who sits on Marley Spoon Group’s board and the CEO’s background.
Other High-Performing Stocks: Are there other stocks that provide better prospects with proven track records? Explore our free list of these great stocks here.
Have feedback on this article? Concerned about the content? Get in touch with us directly. Alternatively, email editorial-team (at) simplywallst.com.
This article by Simply Wall St is general in nature. We provide commentary based on historical data and analyst forecasts only using an unbiased methodology and our articles are not intended to be financial advice. It does not constitute a recommendation to buy or sell any stock, and does not take account of your objectives, or your financial situation. We aim to bring you long-term focused analysis driven by fundamental data. Note that our analysis may not factor in the latest price-sensitive company announcements or qualitative material. Simply Wall St has no position in any stocks mentioned.
