
 Yahoo Finance
 Marston's (LON:MARS) Will Be Looking To Turn Around Its Returns
When we're researching a company, it's sometimes hard to find the warning signs, but there are some financial metrics that can help spot trouble early. Typically, we'll see the trend of both return on capital employed (ROCE) declining and this usually coincides with a decreasing amount of capital employed. Ultimately this means that the company is earning less per dollar invested and on top of that, it's shrinking its base of capital employed. So after glancing at the trends within Marston's (LON:MARS), we weren't too hopeful.
Return On Capital Employed (ROCE): What Is It?
For those who don't know, ROCE is a measure of a company's yearly pre-tax profit (its return), relative to the capital employed in the business. The formula for this calculation on Marston's is:
Return on Capital Employed = Earnings Before Interest and Tax (EBIT) ÷ (Total Assets - Current Liabilities)
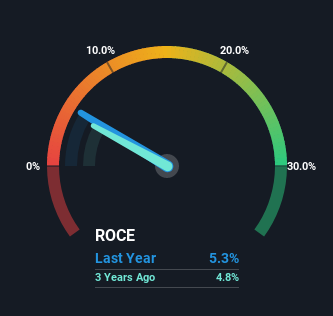
0.053 = UK£119m ÷ (UK£2.5b - UK£271m) (Based on the trailing twelve months to October 2022).
So, Marston's has an ROCE of 5.3%. In absolute terms, that's a low return but it's around the Hospitality industry average of 6.5%.
See our latest analysis for Marston's
Above you can see how the current ROCE for Marston's compares to its prior returns on capital, but there's only so much you can tell from the past. If you'd like, you can check out the forecasts from the analysts covering Marston's here for free.
What Can We Tell From Marston's' ROCE Trend?
In terms of Marston's' historical ROCE movements, the trend doesn't inspire confidence. About five years ago, returns on capital were 6.8%, however they're now substantially lower than that as we saw above. And on the capital employed front, the business is utilizing roughly the same amount of capital as it was back then. Companies that exhibit these attributes tend to not be shrinking, but they can be mature and facing pressure on their margins from competition. If these trends continue, we wouldn't expect Marston's to turn into a multi-bagger.
The Bottom Line On Marston's' ROCE
In the end, the trend of lower returns on the same amount of capital isn't typically an indication that we're looking at a growth stock. Investors haven't taken kindly to these developments, since the stock has declined 63% from where it was five years ago. With underlying trends that aren't great in these areas, we'd consider looking elsewhere.
If you want to continue researching Marston's, you might be interested to know about the 2 warning signs that our analysis has discovered.
While Marston's isn't earning the highest return, check out this free list of companies that are earning high returns on equity with solid balance sheets.
Have feedback on this article? Concerned about the content? Get in touch with us directly. Alternatively, email editorial-team (at) simplywallst.com.
This article by Simply Wall St is general in nature. We provide commentary based on historical data and analyst forecasts only using an unbiased methodology and our articles are not intended to be financial advice. It does not constitute a recommendation to buy or sell any stock, and does not take account of your objectives, or your financial situation. We aim to bring you long-term focused analysis driven by fundamental data. Note that our analysis may not factor in the latest price-sensitive company announcements or qualitative material. Simply Wall St has no position in any stocks mentioned.
Join A Paid User Research Session
You’ll receive a US$30 Amazon Gift card for 1 hour of your time while helping us build better investing tools for the individual investors like yourself. Sign up here
