
 Yahoo Finance
 Is Marston's PLC (LON:MARS) A Good Fit For Your Dividend Portfolio?

Dividend paying stocks like Marston's PLC (LON:MARS) tend to be popular with investors, and for good reason - some research suggests a significant amount of all stock market returns come from reinvested dividends. Yet sometimes, investors buy a stock for its dividend and lose money because the share price falls by more than they earned in dividend payments.
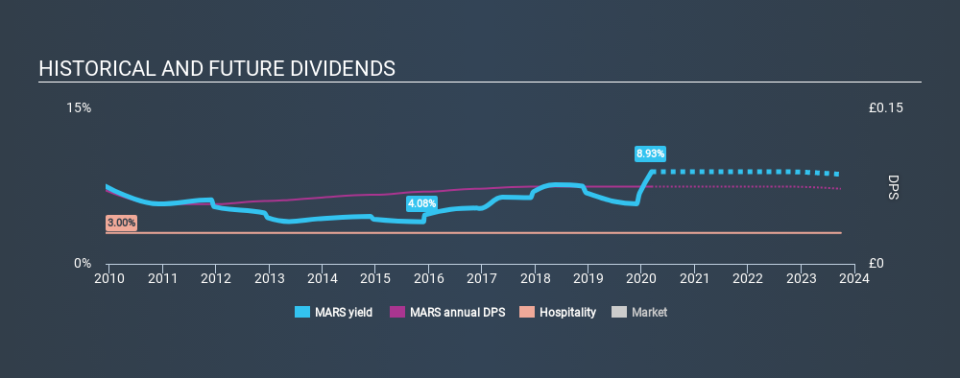
With Marston's yielding 8.9% and having paid a dividend for over 10 years, many investors likely find the company quite interesting. We'd guess that plenty of investors have purchased it for the income. Remember that the recent share price drop will make Marston's's yield look higher, even though recent events might have impacted the company's prospects. There are a few simple ways to reduce the risks of buying Marston's for its dividend, and we'll go through these below.
Click the interactive chart for our full dividend analysis
Payout ratios
Dividends are typically paid from company earnings. If a company pays more in dividends than it earned, then the dividend might become unsustainable - hardly an ideal situation. So we need to form a view on if a company's dividend is sustainable, relative to its net profit after tax. While Marston's pays a dividend, it reported a loss over the last year. When a company recently reported a loss, we should investigate if its cash flows covered the dividend.
Marston's paid out 77% of its cash flow last year. This may be sustainable but it does not leave much of a buffer for unexpected circumstances.
Is Marston's's Balance Sheet Risky?
Given Marston's is paying a dividend but reported a loss over the past year, we need to check its balance sheet for signs of financial distress. A quick check of its financial situation can be done with two ratios: net debt divided by EBITDA (earnings before interest, tax, depreciation and amortisation), and net interest cover. Net debt to EBITDA is a measure of a company's total debt. Net interest cover measures the ability to meet interest payments. Essentially we check that a) the company does not have too much debt, and b) that it can afford to pay the interest. Marston's has net debt of 6.62 times its EBITDA, which implies meaningful risk if interest rates rise of earnings decline.
Net interest cover can be calculated by dividing earnings before interest and tax (EBIT) by the company's net interest expense. Interest cover of 1.20 times its interest expense is starting to become a concern for Marston's, and be aware that lenders may place additional restrictions on the company as well. Low interest cover and high debt can create problems right when the investor least needs them, and we're reluctant to rely on the dividend of companies with these traits.
Consider getting our latest analysis on Marston's's financial position here.
Dividend Volatility
One of the major risks of relying on dividend income, is the potential for a company to struggle financially and cut its dividend. Not only is your income cut, but the value of your investment declines as well - nasty. Marston's has been paying dividends for a long time, but for the purpose of this analysis, we only examine the past 10 years of payments. During this period the dividend has been stable, which could imply the business could have relatively consistent earnings power. During the past ten-year period, the first annual payment was UK£0.071 in 2010, compared to UK£0.075 last year. Its dividends have grown at less than 1% per annum over this time frame.
While the consistency in the dividend payments is impressive, we think the relatively slow rate of growth is unappealing.
Dividend Growth Potential
Dividend payments have been consistent over the past few years, but we should always check if earnings per share (EPS) are growing, as this will help maintain the purchasing power of the dividend. Strong earnings per share (EPS) growth might encourage our interest in the company despite fluctuating dividends, which is why it's great to see Marston's has grown its earnings per share at 21% per annum over the past five years.
Conclusion
To summarise, shareholders should always check that Marston's's dividends are affordable, that its dividend payments are relatively stable, and that it has decent prospects for growing its earnings and dividend. We're a bit uncomfortable with the company paying a dividend while being loss-making, although at least the dividend was covered by free cash flow. Next, growing earnings per share and steady dividend payments is a great combination. While we're not hugely bearish on it, overall we think there are potentially better dividend stocks than Marston's out there.
Companies that are growing earnings tend to be the best dividend stocks over the long term. See what the 13 analysts we track are forecasting for Marston's for free with public analyst estimates for the company.
Looking for more high-yielding dividend ideas? Try our curated list of dividend stocks with a yield above 3%.
If you spot an error that warrants correction, please contact the editor at editorial-team@simplywallst.com. This article by Simply Wall St is general in nature. It does not constitute a recommendation to buy or sell any stock, and does not take account of your objectives, or your financial situation. Simply Wall St has no position in the stocks mentioned.
We aim to bring you long-term focused research analysis driven by fundamental data. Note that our analysis may not factor in the latest price-sensitive company announcements or qualitative material. Thank you for reading.
