
 Yahoo Finance
 Mayville Engineering Company (NYSE:MEC) May Have Issues Allocating Its Capital
When it comes to investing, there are some useful financial metrics that can warn us when a business is potentially in trouble. When we see a declining return on capital employed (ROCE) in conjunction with a declining base of capital employed, that's often how a mature business shows signs of aging. This reveals that the company isn't compounding shareholder wealth because returns are falling and its net asset base is shrinking. So after we looked into Mayville Engineering Company (NYSE:MEC), the trends above didn't look too great.
Understanding Return On Capital Employed (ROCE)
Just to clarify if you're unsure, ROCE is a metric for evaluating how much pre-tax income (in percentage terms) a company earns on the capital invested in its business. The formula for this calculation on Mayville Engineering Company is:
Return on Capital Employed = Earnings Before Interest and Tax (EBIT) ÷ (Total Assets - Current Liabilities)
0.032 = US$9.9m ÷ (US$379m - US$72m) (Based on the trailing twelve months to September 2021).
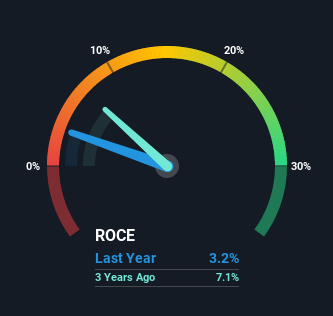
So, Mayville Engineering Company has an ROCE of 3.2%. In absolute terms, that's a low return and it also under-performs the Machinery industry average of 10%.
Check out our latest analysis for Mayville Engineering Company
In the above chart we have measured Mayville Engineering Company's prior ROCE against its prior performance, but the future is arguably more important. If you're interested, you can view the analysts predictions in our free report on analyst forecasts for the company.
What Can We Tell From Mayville Engineering Company's ROCE Trend?
In terms of Mayville Engineering Company's historical ROCE movements, the trend doesn't inspire confidence. About three years ago, returns on capital were 7.1%, however they're now substantially lower than that as we saw above. On top of that, it's worth noting that the amount of capital employed within the business has remained relatively steady. This combination can be indicative of a mature business that still has areas to deploy capital, but the returns received aren't as high due potentially to new competition or smaller margins. If these trends continue, we wouldn't expect Mayville Engineering Company to turn into a multi-bagger.
What We Can Learn From Mayville Engineering Company's ROCE
In the end, the trend of lower returns on the same amount of capital isn't typically an indication that we're looking at a growth stock. However the stock has delivered a 12% return to shareholders over the last year, so investors might be expecting the trends to turn around. Regardless, we don't feel too comfortable with the fundamentals so we'd be steering clear of this stock for now.
On a separate note, we've found 1 warning sign for Mayville Engineering Company you'll probably want to know about.
While Mayville Engineering Company may not currently earn the highest returns, we've compiled a list of companies that currently earn more than 25% return on equity. Check out this free list here.
Have feedback on this article? Concerned about the content? Get in touch with us directly. Alternatively, email editorial-team (at) simplywallst.com.
This article by Simply Wall St is general in nature. We provide commentary based on historical data and analyst forecasts only using an unbiased methodology and our articles are not intended to be financial advice. It does not constitute a recommendation to buy or sell any stock, and does not take account of your objectives, or your financial situation. We aim to bring you long-term focused analysis driven by fundamental data. Note that our analysis may not factor in the latest price-sensitive company announcements or qualitative material. Simply Wall St has no position in any stocks mentioned.
