
 Yahoo Finance
 Is McBride plc’s (LON:MCB) Balance Sheet A Threat To Its Future?

While small-cap stocks, such as McBride plc (LON:MCB) with its market cap of UK£254.50m, are popular for their explosive growth, investors should also be aware of their balance sheet to judge whether the company can survive a downturn. Since MCB is loss-making right now, it’s vital to understand the current state of its operations and pathway to profitability. I believe these basic checks tell most of the story you need to know. Nevertheless, I know these factors are very high-level, so I recommend you dig deeper yourself into MCB here.
How does MCB’s operating cash flow stack up against its debt?
Over the past year, MCB has reduced its debt from UK£115.70m to UK£101.80m , which is made up of current and long term debt. With this debt payback, MCB’s cash and short-term investments stands at UK£26.00m for investing into the business. On top of this, MCB has produced UK£37.30m in operating cash flow during the same period of time, leading to an operating cash to total debt ratio of 36.64%, meaning that MCB’s operating cash is sufficient to cover its debt. This ratio can also be interpreted as a measure of efficiency for loss making businesses since metrics such as return on asset (ROA) requires positive earnings. In MCB’s case, it is able to generate 0.37x cash from its debt capital.
Does MCB’s liquid assets cover its short-term commitments?
Looking at MCB’s most recent UK£241.30m liabilities, the company has been able to meet these obligations given the level of current assets of UK£244.60m, with a current ratio of 1.01x. Usually, for Household Products companies, this is a suitable ratio as there’s enough of a cash buffer without holding too capital in low return investments.
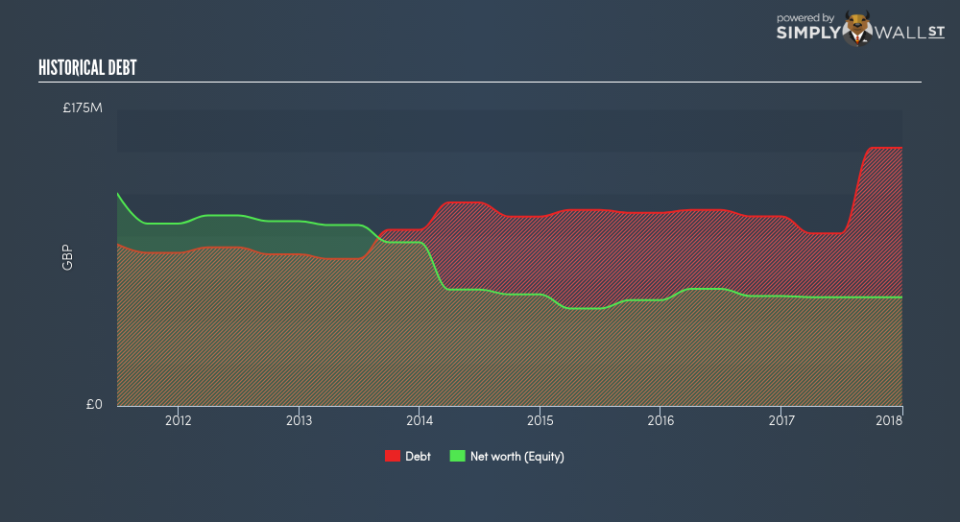
Does MCB face the risk of succumbing to its debt-load?
MCB is a highly-leveraged company with debt exceeding equity by over 100%. This is not uncommon for a small-cap company given that debt tends to be lower-cost and at times, more accessible. Though, since MCB is currently loss-making, there’s a question of sustainability of its current operations. Maintaining a high level of debt, while revenues are still below costs, can be dangerous as liquidity tends to dry up in unexpected downturns.
Next Steps:
MCB’s high cash coverage means that, although its debt levels are high, the company is able to utilise its borrowings efficiently in order to generate cash flow. This may mean this is an optimal capital structure for the business, given that it is also meeting its short-term commitment. I admit this is a fairly basic analysis for MCB’s financial health. Other important fundamentals need to be considered alongside. I suggest you continue to research McBride to get a more holistic view of the small-cap by looking at:
Future Outlook: What are well-informed industry analysts predicting for MCB’s future growth? Take a look at our free research report of analyst consensus for MCB’s outlook.
Valuation: What is MCB worth today? Is the stock undervalued, even when its growth outlook is factored into its intrinsic value? The intrinsic value infographic in our free research report helps visualize whether MCB is currently mispriced by the market.
Other High-Performing Stocks: Are there other stocks that provide better prospects with proven track records? Explore our free list of these great stocks here.
To help readers see pass the short term volatility of the financial market, we aim to bring you a long-term focused research analysis purely driven by fundamental data. Note that our analysis does not factor in the latest price sensitive company announcements.
The author is an independent contributor and at the time of publication had no position in the stocks mentioned.
