
 Yahoo Finance
 Is Medpace Holdings, Inc.'s (NASDAQ:MEDP) P/E Ratio Really That Good?

This article is written for those who want to get better at using price to earnings ratios (P/E ratios). We'll show how you can use Medpace Holdings, Inc.'s (NASDAQ:MEDP) P/E ratio to inform your assessment of the investment opportunity. What is Medpace Holdings's P/E ratio? Well, based on the last twelve months it is 31.88. That is equivalent to an earnings yield of about 3.1%.
Check out our latest analysis for Medpace Holdings
How Do You Calculate A P/E Ratio?
The formula for P/E is:
Price to Earnings Ratio = Price per Share ÷ Earnings per Share (EPS)
Or for Medpace Holdings:
P/E of 31.88 = $82.97 ÷ $2.60 (Based on the trailing twelve months to September 2019.)
Is A High P/E Ratio Good?
A higher P/E ratio means that investors are paying a higher price for each $1 of company earnings. That isn't a good or a bad thing on its own, but a high P/E means that buyers have a higher opinion of the business's prospects, relative to stocks with a lower P/E.
How Does Medpace Holdings's P/E Ratio Compare To Its Peers?
The P/E ratio indicates whether the market has higher or lower expectations of a company. The image below shows that Medpace Holdings has a lower P/E than the average (36.4) P/E for companies in the life sciences industry.
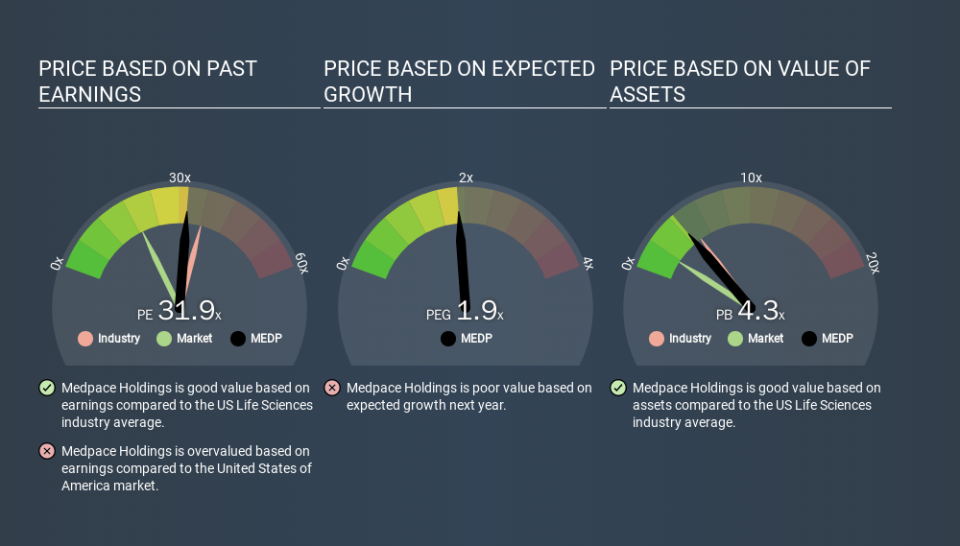
Medpace Holdings's P/E tells us that market participants think it will not fare as well as its peers in the same industry. Many investors like to buy stocks when the market is pessimistic about their prospects. If you consider the stock interesting, further research is recommended. For example, I often monitor director buying and selling.
How Growth Rates Impact P/E Ratios
Probably the most important factor in determining what P/E a company trades on is the earnings growth. That's because companies that grow earnings per share quickly will rapidly increase the 'E' in the equation. And in that case, the P/E ratio itself will drop rather quickly. So while a stock may look expensive based on past earnings, it could be cheap based on future earnings.
In the last year, Medpace Holdings grew EPS like Taylor Swift grew her fan base back in 2010; the 52% gain was both fast and well deserved. Even better, EPS is up 162% per year over three years. So we'd absolutely expect it to have a relatively high P/E ratio.
Remember: P/E Ratios Don't Consider The Balance Sheet
Don't forget that the P/E ratio considers market capitalization. That means it doesn't take debt or cash into account. In theory, a company can lower its future P/E ratio by using cash or debt to invest in growth.
Such spending might be good or bad, overall, but the key point here is that you need to look at debt to understand the P/E ratio in context.
Medpace Holdings's Balance Sheet
Since Medpace Holdings holds net cash of US$79m, it can spend on growth, justifying a higher P/E ratio than otherwise.
The Verdict On Medpace Holdings's P/E Ratio
Medpace Holdings trades on a P/E ratio of 31.9, which is above its market average of 18.9. Its net cash position is the cherry on top of its superb EPS growth. To us, this is the sort of company that we would expect to carry an above average price tag (relative to earnings).
When the market is wrong about a stock, it gives savvy investors an opportunity. If the reality for a company is better than it expects, you can make money by buying and holding for the long term. So this free visual report on analyst forecasts could hold the key to an excellent investment decision.
Of course, you might find a fantastic investment by looking at a few good candidates. So take a peek at this free list of companies with modest (or no) debt, trading on a P/E below 20.
If you spot an error that warrants correction, please contact the editor at editorial-team@simplywallst.com. This article by Simply Wall St is general in nature. It does not constitute a recommendation to buy or sell any stock, and does not take account of your objectives, or your financial situation. Simply Wall St has no position in the stocks mentioned.
We aim to bring you long-term focused research analysis driven by fundamental data. Note that our analysis may not factor in the latest price-sensitive company announcements or qualitative material. Thank you for reading.
