
 Yahoo Finance
 Is Mera SA.’s (WSE:MER) Balance Sheet Strong Enough To Weather A Storm?

While small-cap stocks, such as Mera SA. (WSE:MER) with its market cap of ZŁ10.40M, are popular for their explosive growth, investors should also be aware of their balance sheet to judge whether the company can survive a downturn. So, understanding the company’s financial health becomes vital, as mismanagement of capital can lead to bankruptcies, which occur at a higher rate for small-caps. I believe these basic checks tell most of the story you need to know. Nevertheless, this commentary is still very high-level, so I’d encourage you to dig deeper yourself into MER here.
How does MER’s operating cash flow stack up against its debt?
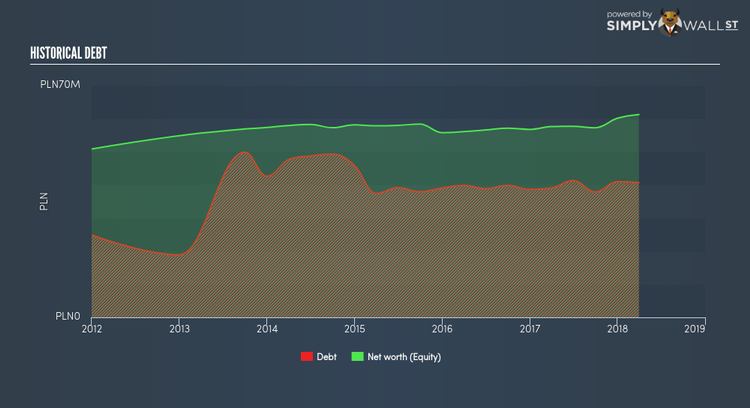
Over the past year, MER has ramped up its debt from ZŁ38.67M to ZŁ40.99M , which is made up of current and long term debt. With this rise in debt, the current cash and short-term investment levels stands at ZŁ6.58M for investing into the business. On top of this, MER has produced ZŁ7.07M in operating cash flow in the last twelve months, resulting in an operating cash to total debt ratio of 17.26%, meaning that MER’s operating cash is not sufficient to cover its debt. This ratio can also be a sign of operational efficiency as an alternative to return on assets. In MER’s case, it is able to generate 0.17x cash from its debt capital.
Can MER meet its short-term obligations with the cash in hand?
Looking at MER’s most recent ZŁ22.64M liabilities, it seems that the business has been able to meet these commitments with a current assets level of ZŁ42.49M, leading to a 1.88x current account ratio. Usually, for Building companies, this is a suitable ratio as there’s enough of a cash buffer without holding too capital in low return investments.
Can MER service its debt comfortably?
MER is a relatively highly levered company with a debt-to-equity of 66.40%. This is not unusual for small-caps as debt tends to be a cheaper and faster source of funding for some businesses. No matter how high the company’s debt, if it can easily cover the interest payments, it’s considered to be efficient with its use of excess leverage. A company generating earnings after interest and tax at least three times its net interest payments is considered financially sound. In MER’s case, the ratio of 5.56x suggests that interest is appropriately covered, which means that lenders may be less hesitant to lend out more funding as MER’s high interest coverage is seen as responsible and safe practice.
Next Steps:
At its current level of cash flow coverage, MER has room for improvement to better cushion for events which may require debt repayment. However, the company will be able to pay all of its upcoming liabilities from its current short-term assets. This is only a rough assessment of financial health, and I’m sure MER has company-specific issues impacting its capital structure decisions. You should continue to research Mera to get a better picture of the stock by looking at:
Historical Performance: What has MER’s returns been like over the past? Go into more detail in the past track record analysis and take a look at the free visual representations of our analysis for more clarity.
Other High-Performing Stocks: Are there other stocks that provide better prospects with proven track records? Explore our free list of these great stocks here.
To help readers see pass the short term volatility of the financial market, we aim to bring you a long-term focused research analysis purely driven by fundamental data. Note that our analysis does not factor in the latest price sensitive company announcements.
The author is an independent contributor and at the time of publication had no position in the stocks mentioned.
