
 Yahoo Finance
 Metcash's (ASX:MTS) investors will be pleased with their decent 75% return over the last five years
Generally speaking the aim of active stock picking is to find companies that provide returns that are superior to the market average. And in our experience, buying the right stocks can give your wealth a significant boost. To wit, the Metcash share price has climbed 36% in five years, easily topping the market return of 20% (ignoring dividends). On the other hand, the more recent gains haven't been so impressive, with shareholders gaining just 3.9% , including dividends .
With that in mind, it's worth seeing if the company's underlying fundamentals have been the driver of long term performance, or if there are some discrepancies.
See our latest analysis for Metcash
There is no denying that markets are sometimes efficient, but prices do not always reflect underlying business performance. One flawed but reasonable way to assess how sentiment around a company has changed is to compare the earnings per share (EPS) with the share price.
During the five years of share price growth, Metcash moved from a loss to profitability. That's generally thought to be a genuine positive, so investors may expect to see an increasing share price. Since the company was unprofitable five years ago, but not three years ago, it's worth taking a look at the returns in the last three years, too. We can see that the Metcash share price is up 1.0% in the last three years. During the same period, EPS grew by 3.5% each year. This EPS growth is higher than the 0.3% average annual increase in the share price over the same three years. Therefore, it seems the market has moderated its expectations for growth, somewhat.
You can see how EPS has changed over time in the image below (click on the chart to see the exact values).
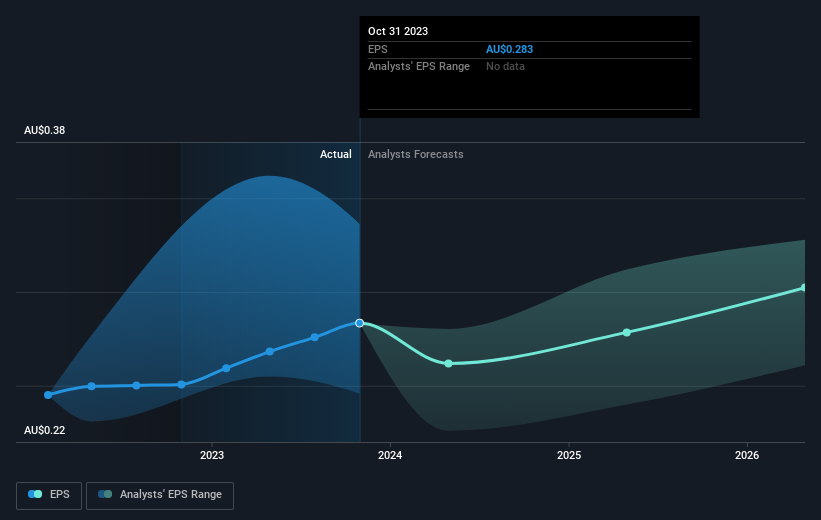
We know that Metcash has improved its bottom line lately, but is it going to grow revenue? This free report showing analyst revenue forecasts should help you figure out if the EPS growth can be sustained.
What About Dividends?
As well as measuring the share price return, investors should also consider the total shareholder return (TSR). Whereas the share price return only reflects the change in the share price, the TSR includes the value of dividends (assuming they were reinvested) and the benefit of any discounted capital raising or spin-off. Arguably, the TSR gives a more comprehensive picture of the return generated by a stock. We note that for Metcash the TSR over the last 5 years was 75%, which is better than the share price return mentioned above. This is largely a result of its dividend payments!
A Different Perspective
Metcash shareholders are up 3.9% for the year (even including dividends). Unfortunately this falls short of the market return. It's probably a good sign that the company has an even better long term track record, having provided shareholders with an annual TSR of 12% over five years. It may well be that this is a business worth popping on the watching, given the continuing positive reception, over time, from the market. It's always interesting to track share price performance over the longer term. But to understand Metcash better, we need to consider many other factors. Even so, be aware that Metcash is showing 2 warning signs in our investment analysis , you should know about...
Of course, you might find a fantastic investment by looking elsewhere. So take a peek at this free list of companies we expect will grow earnings.
Please note, the market returns quoted in this article reflect the market weighted average returns of stocks that currently trade on Australian exchanges.
Have feedback on this article? Concerned about the content? Get in touch with us directly. Alternatively, email editorial-team (at) simplywallst.com.
This article by Simply Wall St is general in nature. We provide commentary based on historical data and analyst forecasts only using an unbiased methodology and our articles are not intended to be financial advice. It does not constitute a recommendation to buy or sell any stock, and does not take account of your objectives, or your financial situation. We aim to bring you long-term focused analysis driven by fundamental data. Note that our analysis may not factor in the latest price-sensitive company announcements or qualitative material. Simply Wall St has no position in any stocks mentioned.
