
 Yahoo Finance
 These Metrics Don't Make Revlon (NYSE:REV) Look Too Strong

When we're researching a company, it's sometimes hard to find the warning signs, but there are some financial metrics that can help spot trouble early. More often than not, we'll see a declining return on capital employed (ROCE) and a declining amount of capital employed. This combination can tell you that not only is the company investing less, it's earning less on what it does invest. On that note, looking into Revlon (NYSE:REV), we weren't too upbeat about how things were going.
Return On Capital Employed (ROCE): What is it?
If you haven't worked with ROCE before, it measures the 'return' (pre-tax profit) a company generates from capital employed in its business. Analysts use this formula to calculate it for Revlon:
Return on Capital Employed = Earnings Before Interest and Tax (EBIT) ÷ (Total Assets - Current Liabilities)
0.027 = US$47m ÷ (US$3.0b - US$1.3b) (Based on the trailing twelve months to June 2020).
Thus, Revlon has an ROCE of 2.7%. In absolute terms, that's a low return and it also under-performs the Personal Products industry average of 15%.
View our latest analysis for Revlon
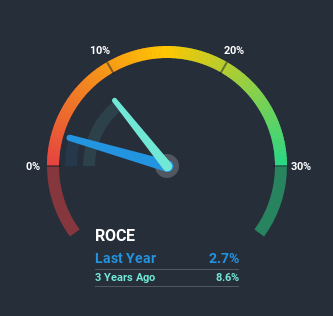
Above you can see how the current ROCE for Revlon compares to its prior returns on capital, but there's only so much you can tell from the past. If you'd like, you can check out the forecasts from the analysts covering Revlon here for free.
How Are Returns Trending?
We are a bit worried about the trend of returns on capital at Revlon. To be more specific, the ROCE was 17% five years ago, but since then it has dropped noticeably. And on the capital employed front, the business is utilizing roughly the same amount of capital as it was back then. Since returns are falling and the business has the same amount of assets employed, this can suggest it's a mature business that hasn't had much growth in the last five years. If these trends continue, we wouldn't expect Revlon to turn into a multi-bagger.
While on the subject, we noticed that the ratio of current liabilities to total assets has risen to 42%, which has impacted the ROCE. If current liabilities hadn't increased as much as they did, the ROCE could actually be even lower. What this means is that in reality, a rather large portion of the business is being funded by the likes of the company's suppliers or short-term creditors, which can bring some risks of its own.
The Bottom Line On Revlon's ROCE
In the end, the trend of lower returns on the same amount of capital isn't typically an indication that we're looking at a growth stock. Unsurprisingly then, the stock has dived 77% over the last five years, so investors are recognizing these changes and don't like the company's prospects. With underlying trends that aren't great in these areas, we'd consider looking elsewhere.
On a final note, we found 3 warning signs for Revlon (1 is concerning) you should be aware of.
If you want to search for solid companies with great earnings, check out this free list of companies with good balance sheets and impressive returns on equity.
This article by Simply Wall St is general in nature. It does not constitute a recommendation to buy or sell any stock, and does not take account of your objectives, or your financial situation. We aim to bring you long-term focused analysis driven by fundamental data. Note that our analysis may not factor in the latest price-sensitive company announcements or qualitative material. Simply Wall St has no position in any stocks mentioned.
Have feedback on this article? Concerned about the content? Get in touch with us directly. Alternatively, email editorial-team@simplywallst.com.
