
 Yahoo Finance
 Midwich Group's (LON:MIDW) Shareholders Are Down 35% On Their Shares

It's easy to match the overall market return by buying an index fund. But if you buy individual stocks, you can do both better or worse than that. Unfortunately the Midwich Group Plc (LON:MIDW) share price slid 35% over twelve months. That's well below the market decline of 9.4%. However, the longer term returns haven't been so bad, with the stock down 21% in the last three years. Unfortunately the share price momentum is still quite negative, with prices down 15% in thirty days. Importantly, this could be a market reaction to the recently released financial results. You can check out the latest numbers in our company report.
Check out our latest analysis for Midwich Group
To quote Buffett, 'Ships will sail around the world but the Flat Earth Society will flourish. There will continue to be wide discrepancies between price and value in the marketplace...' One flawed but reasonable way to assess how sentiment around a company has changed is to compare the earnings per share (EPS) with the share price.
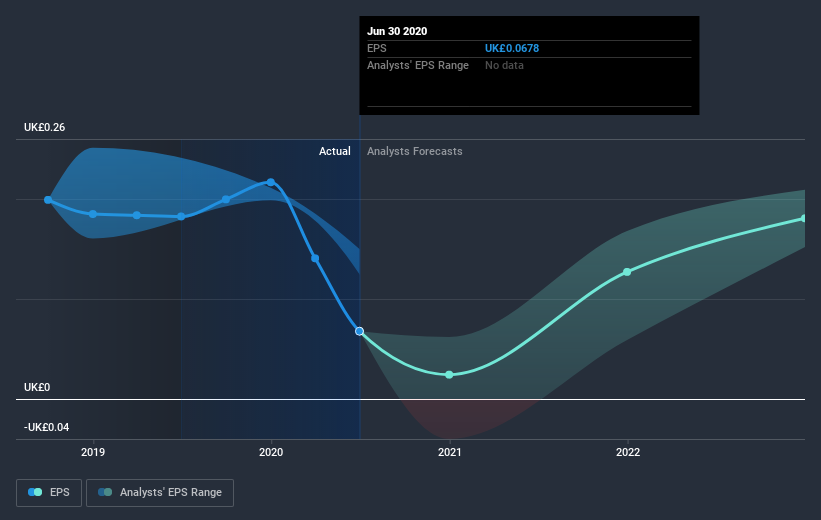
Unhappily, Midwich Group had to report a 63% decline in EPS over the last year. This fall in the EPS is significantly worse than the 35% the share price fall. It may have been that the weak EPS was not as bad as some had feared. Indeed, with a P/E ratio of 50.74 there is obviously some real optimism that earnings will bounce back.
You can see below how EPS has changed over time (discover the exact values by clicking on the image).
It's good to see that there was some significant insider buying in the last three months. That's a positive. On the other hand, we think the revenue and earnings trends are much more meaningful measures of the business. It might be well worthwhile taking a look at our free report on Midwich Group's earnings, revenue and cash flow.
What about the Total Shareholder Return (TSR)?
We'd be remiss not to mention the difference between Midwich Group's total shareholder return (TSR) and its share price return. The TSR attempts to capture the value of dividends (as if they were reinvested) as well as any spin-offs or discounted capital raisings offered to shareholders. Dividends have been really beneficial for Midwich Group shareholders, and that cash payout explains why its total shareholder loss of 35%, over the last year, isn't as bad as the share price return.
A Different Perspective
The last twelve months weren't great for Midwich Group shares, which performed worse than the market, costing holders 35%. Meanwhile, the broader market slid about 9.4%, likely weighing on the stock. The three-year loss of 6% per year isn't as bad as the last twelve months, suggesting that the company has not been able to convince the market it has solved its problems. We would be wary of buying into a company with unsolved problems, although some investors will buy into struggling stocks if they believe the price is sufficiently attractive. It's always interesting to track share price performance over the longer term. But to understand Midwich Group better, we need to consider many other factors. For example, we've discovered 3 warning signs for Midwich Group that you should be aware of before investing here.
There are plenty of other companies that have insiders buying up shares. You probably do not want to miss this free list of growing companies that insiders are buying.
Please note, the market returns quoted in this article reflect the market weighted average returns of stocks that currently trade on GB exchanges.
This article by Simply Wall St is general in nature. It does not constitute a recommendation to buy or sell any stock, and does not take account of your objectives, or your financial situation. We aim to bring you long-term focused analysis driven by fundamental data. Note that our analysis may not factor in the latest price-sensitive company announcements or qualitative material. Simply Wall St has no position in any stocks mentioned.
Have feedback on this article? Concerned about the content? Get in touch with us directly. Alternatively, email editorial-team@simplywallst.com.
