
 Yahoo Finance
 What might the 5-year price chart tell us about BT shares?
Telecom giant BT (LSE: BT.A) remains a popular share with retail investors. But BT shares have been a disaster for many owners.
Over the past five years, they have more than halved in value. The past 12 months alone have seen a 22% drop in the BT share price.
A 7.1% dividend yield helps to cushion the blow of weak share price performance.
Still, even that has been unreliable. There were no dividends in 2021. The payout per share has halved since 2019.
Does this mean BT is a duff share doomed to weak performance? Or could the long-term price fall offer a buying opportunity for my portfolio?
Relentless challenges
Decades ago, BT had a monopoly on a service used by almost all homes and businesses. They sent customers bills that often did not even break down in great detail what they were paying for.
The telecoms industry has changed radically since then, posing some big challenges to BT. There is far more competition. New technologies mean that BT’s legacy business has been in long-term decline.
On top of that, BT has been carrying sizeable pension obligations that continue to pose a big financial burden.
Earnings resilience
If anything, it is impressive that earnings per share have been fairly robust over the past few years.
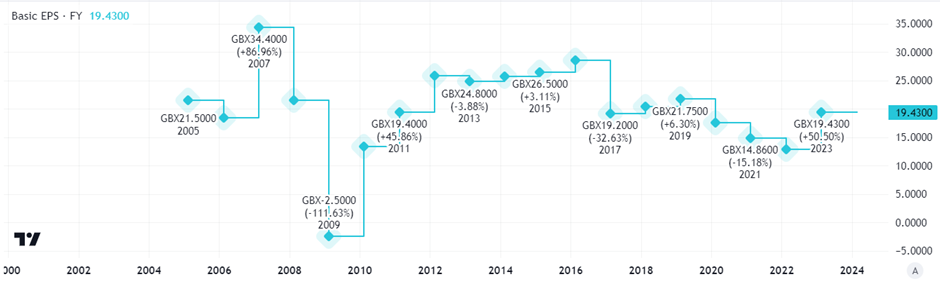
Indeed, BT shares currently trade on a price-to-earnings ratio of just six. That may seem very cheap.
Earnings can include non-cash items, however, so on their own they do not necessarily give us the full picture about how a company is performing financially.
Consider the free cash flow picture at BT – how much hard cold money is actually coming in or going out of the door each year. Here the performance moves around a fair bit.

Created at TradingView
As an investor that concerns me. BT has faced a number of challenges to its free cash flow, from high capital expenditure requirements to the need to top up its pension fund repeatedly. Such risks continue.
Indeed, one way to improve free cash flows is to reduce expenditure on dividends. That may help explain why, over the long run, the annual dividend paid on each BT share has been repeatedly cut.

Created at TradingView
Last year’s dividend was the same as the prior year’s. The most recent, interim, payout was also held flat.
As the company explained in its 2023 annual report, “as we continue through the most intensive phase of our full fibre investment programme, capital expenditure will remain high with a corresponding impact on our normalised free cash flow“.
Share price disappointment
I think the performance of BT shares over both one and five years points to the same concerns.
A declining legacy business, ongoing capital expenditure requirements notably in its Openreach division, and uncertain ultimate pension obligations are all long-term clouds hanging over the company’s valuation.
On top of that, net debt grew at the interim stage to almost £20bn. That is almost double BT’s market capitalisation.
The business remains profitable and I do see growth opportunities, especially in Openreach. It also benefits from a well-known brand.
But I think the decline of BT shares reflects ongoing challenges facing the company. I have no plans to invest.
The post What might the 5-year price chart tell us about BT shares? appeared first on The Motley Fool UK.
More reading
C Ruane has no position in any of the shares mentioned. The Motley Fool UK has no position in any of the shares mentioned. Views expressed on the companies mentioned in this article are those of the writer and therefore may differ from the official recommendations we make in our subscription services such as Share Advisor, Hidden Winners and Pro. Here at The Motley Fool we believe that considering a diverse range of insights makes us better investors.
Motley Fool UK 2024
