
 Yahoo Finance
 What Is Mission Group's (LON:TMG) P/E Ratio After Its Share Price Tanked?

Unfortunately for some shareholders, the Mission Group (LON:TMG) share price has dived 60% in the last thirty days. That drop has capped off a tough year for shareholders, with the share price down 36% in that time.
Assuming nothing else has changed, a lower share price makes a stock more attractive to potential buyers. In the long term, share prices tend to follow earnings per share, but in the short term prices bounce around in response to short term factors (which are not always obvious). So, on certain occasions, long term focussed investors try to take advantage of pessimistic expectations to buy shares at a better price. One way to gauge market expectations of a stock is to look at its Price to Earnings Ratio (PE Ratio). Investors have optimistic expectations of companies with higher P/E ratios, compared to companies with lower P/E ratios.
View our latest analysis for Mission Group
Does Mission Group Have A Relatively High Or Low P/E For Its Industry?
We can tell from its P/E ratio of 6.25 that sentiment around Mission Group isn't particularly high. We can see in the image below that the average P/E (16.0) for companies in the media industry is higher than Mission Group's P/E.
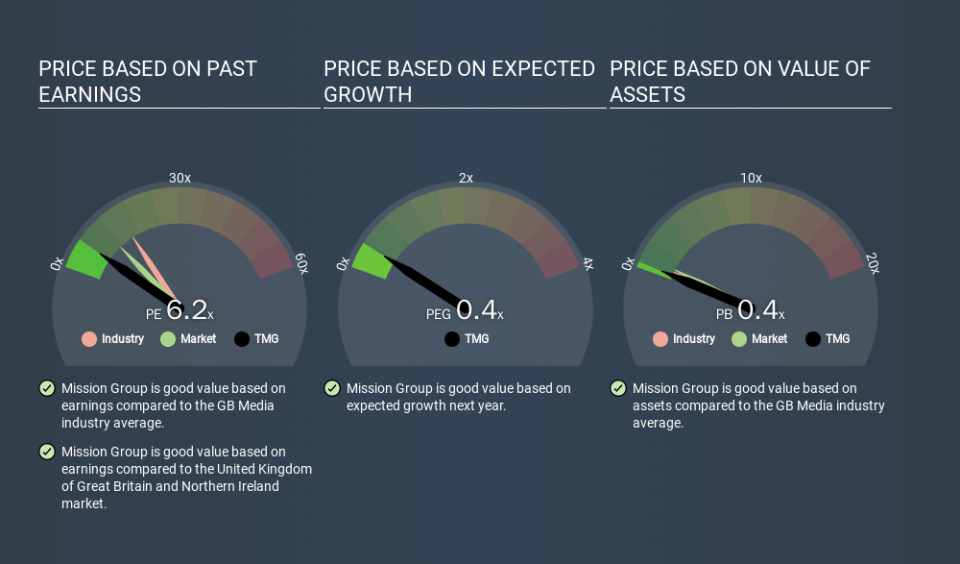
This suggests that market participants think Mission Group will underperform other companies in its industry. Since the market seems unimpressed with Mission Group, it's quite possible it could surprise on the upside. You should delve deeper. I like to check if company insiders have been buying or selling.
How Growth Rates Impact P/E Ratios
Probably the most important factor in determining what P/E a company trades on is the earnings growth. Earnings growth means that in the future the 'E' will be higher. That means even if the current P/E is high, it will reduce over time if the share price stays flat. So while a stock may look expensive based on past earnings, it could be cheap based on future earnings.
Most would be impressed by Mission Group earnings growth of 19% in the last year. And its annual EPS growth rate over 5 years is 4.7%. With that performance, you might expect an above average P/E ratio.
Remember: P/E Ratios Don't Consider The Balance Sheet
It's important to note that the P/E ratio considers the market capitalization, not the enterprise value. That means it doesn't take debt or cash into account. Hypothetically, a company could reduce its future P/E ratio by spending its cash (or taking on debt) to achieve higher earnings.
While growth expenditure doesn't always pay off, the point is that it is a good option to have; but one that the P/E ratio ignores.
How Does Mission Group's Debt Impact Its P/E Ratio?
Mission Group's net debt is 15% of its market cap. This could bring some additional risk, and reduce the number of investment options for management; worth remembering if you compare its P/E to businesses without debt.
The Bottom Line On Mission Group's P/E Ratio
Mission Group trades on a P/E ratio of 6.2, which is below the GB market average of 11.2. The company does have a little debt, and EPS growth was good last year. The low P/E ratio suggests current market expectations are muted, implying these levels of growth will not continue. Because analysts are predicting more growth in the future, one might have expected to see a higher P/E ratio. You can take a closer look at the fundamentals, here. What can be absolutely certain is that the market has become more pessimistic about Mission Group over the last month, with the P/E ratio falling from 15.5 back then to 6.2 today. For those who prefer invest in growth, this stock apparently offers limited promise, but the deep value investors may find the pessimism around this stock enticing.
Investors have an opportunity when market expectations about a stock are wrong. As value investor Benjamin Graham famously said, 'In the short run, the market is a voting machine but in the long run, it is a weighing machine. So this free visualization of the analyst consensus on future earnings could help you make the right decision about whether to buy, sell, or hold.
You might be able to find a better buy than Mission Group. If you want a selection of possible winners, check out this free list of interesting companies that trade on a P/E below 20 (but have proven they can grow earnings).
If you spot an error that warrants correction, please contact the editor at editorial-team@simplywallst.com. This article by Simply Wall St is general in nature. It does not constitute a recommendation to buy or sell any stock, and does not take account of your objectives, or your financial situation. Simply Wall St has no position in the stocks mentioned.
We aim to bring you long-term focused research analysis driven by fundamental data. Note that our analysis may not factor in the latest price-sensitive company announcements or qualitative material. Thank you for reading.
