
 Yahoo Finance
 Can Mixed Financials Have A Negative Impact on The Environmental Group Limited's 's (ASX:EGL) Current Price Momentum?
Environmental Group's (ASX:EGL) stock up by 8.3% over the past three months. Given that the stock prices usually follow long-term business performance, we wonder if the company's mixed financials could have any adverse effect on its current price price movement Particularly, we will be paying attention to Environmental Group's ROE today.
Return on equity or ROE is an important factor to be considered by a shareholder because it tells them how effectively their capital is being reinvested. In short, ROE shows the profit each dollar generates with respect to its shareholder investments.
See our latest analysis for Environmental Group
How To Calculate Return On Equity?
ROE can be calculated by using the formula:
Return on Equity = Net Profit (from continuing operations) ÷ Shareholders' Equity
So, based on the above formula, the ROE for Environmental Group is:
9.2% = AU$2.1m ÷ AU$23m (Based on the trailing twelve months to December 2021).
The 'return' is the amount earned after tax over the last twelve months. Another way to think of that is that for every A$1 worth of equity, the company was able to earn A$0.09 in profit.
What Has ROE Got To Do With Earnings Growth?
We have already established that ROE serves as an efficient profit-generating gauge for a company's future earnings. Depending on how much of these profits the company reinvests or "retains", and how effectively it does so, we are then able to assess a company’s earnings growth potential. Generally speaking, other things being equal, firms with a high return on equity and profit retention, have a higher growth rate than firms that don’t share these attributes.
Environmental Group's Earnings Growth And 9.2% ROE
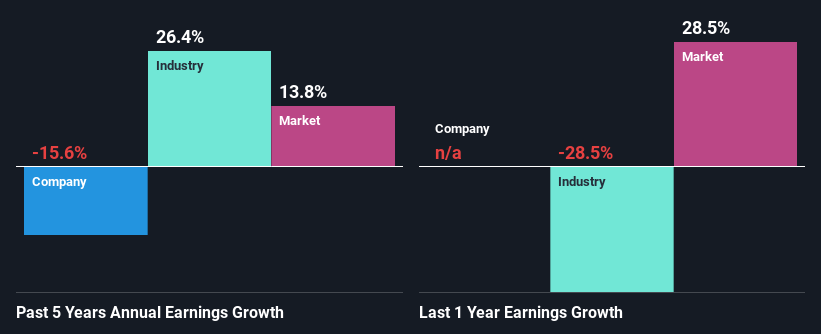
At first glance, Environmental Group's ROE doesn't look very promising. Yet, a closer study shows that the company's ROE is similar to the industry average of 9.9%. But then again, Environmental Group's five year net income shrunk at a rate of 16%. Bear in mind, the company does have a slightly low ROE. Therefore, the decline in earnings could also be the result of this.
So, as a next step, we compared Environmental Group's performance against the industry and were disappointed to discover that while the company has been shrinking its earnings, the industry has been growing its earnings at a rate of 26% in the same period.
Earnings growth is an important metric to consider when valuing a stock. The investor should try to establish if the expected growth or decline in earnings, whichever the case may be, is priced in. By doing so, they will have an idea if the stock is headed into clear blue waters or if swampy waters await. If you're wondering about Environmental Group's's valuation, check out this gauge of its price-to-earnings ratio, as compared to its industry.
Is Environmental Group Efficiently Re-investing Its Profits?
While the company did payout a portion of its dividend in the past, it currently doesn't pay a dividend. This implies that potentially all of its profits are being reinvested in the business.
Summary
Overall, we have mixed feelings about Environmental Group. While the company does have a high rate of profit retention, its low rate of return is probably hampering its earnings growth. Wrapping up, we would proceed with caution with this company and one way of doing that would be to look at the risk profile of the business. To know the 4 risks we have identified for Environmental Group visit our risks dashboard for free.
Have feedback on this article? Concerned about the content? Get in touch with us directly. Alternatively, email editorial-team (at) simplywallst.com.
This article by Simply Wall St is general in nature. We provide commentary based on historical data and analyst forecasts only using an unbiased methodology and our articles are not intended to be financial advice. It does not constitute a recommendation to buy or sell any stock, and does not take account of your objectives, or your financial situation. We aim to bring you long-term focused analysis driven by fundamental data. Note that our analysis may not factor in the latest price-sensitive company announcements or qualitative material. Simply Wall St has no position in any stocks mentioned.
