
 Yahoo Finance
 Miyaji Engineering GroupInc And Two More Top Dividend Stocks
Japan's stock markets have shown a mixed performance recently, with the Nikkei 225 Index seeing modest gains while the broader TOPIX Index experienced slight declines. This nuanced landscape sets an interesting stage for investors looking at dividend stocks such as Miyaji Engineering GroupInc, which can offer potential stability and steady income streams in fluctuating markets. In current conditions, good dividend stocks typically feature robust financial health and a consistent track record of returning value to shareholders, making them potentially appealing amidst economic uncertainties.
Top 10 Dividend Stocks In Japan
Name | Dividend Yield | Dividend Rating |
Yamato Kogyo (TSE:5444) | 3.88% | ★★★★★★ |
Business Brain Showa-Ota (TSE:9658) | 3.59% | ★★★★★★ |
Globeride (TSE:7990) | 3.65% | ★★★★★★ |
Kuriyama Holdings (TSE:3355) | 3.60% | ★★★★★★ |
FALCO HOLDINGS (TSE:4671) | 6.73% | ★★★★★★ |
KurimotoLtd (TSE:5602) | 5.17% | ★★★★★★ |
Japan Pulp and Paper (TSE:8032) | 4.25% | ★★★★★★ |
GakkyushaLtd (TSE:9769) | 4.17% | ★★★★★★ |
Nichimo (TSE:8091) | 4.28% | ★★★★★★ |
Innotech (TSE:9880) | 4.05% | ★★★★★★ |
Click here to see the full list of 393 stocks from our Top Dividend Stocks screener.
We're going to check out a few of the best picks from our screener tool.
Miyaji Engineering GroupInc
Simply Wall St Dividend Rating: ★★★★★☆
Overview: Miyaji Engineering Group, Inc. operates in the construction and civil engineering sectors primarily in Japan, with a market capitalization of approximately ¥66.62 billion.
Operations: Miyaji Engineering Group, Inc. generates revenue primarily through its Miyaji Engineering and M M Bridge segments, with revenues of ¥40.58 billion and ¥29.64 billion respectively.
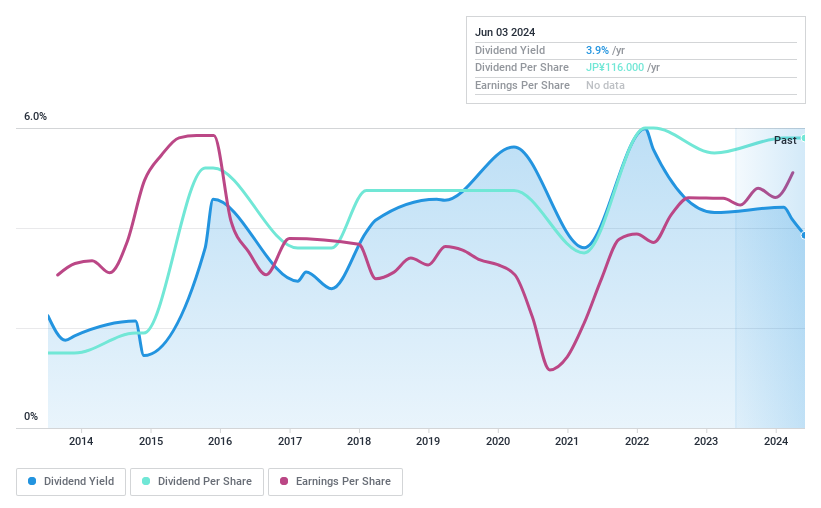
Dividend Yield: 4%
Miyaji Engineering GroupInc has shown a mixed performance in terms of dividend reliability. While the company's dividends are well-covered by both earnings and cash flows, with payout ratios of 56.9% and 38.4% respectively, its dividend track record over the past decade has been unstable and unreliable, marked by significant volatility. Recently, on May 14, 2024, Miyaji announced an increase in its annual dividend to JPY 107 per share for fiscal year ending March 31, 2024; however, it also projected a lower future dividend of JPY 85 per share for the second quarter of FY ending March 31, 2025.
Dive into the specifics of Miyaji Engineering GroupInc here with our thorough dividend report.
Our valuation report here indicates Miyaji Engineering GroupInc may be overvalued.

Chiyoda IntegreLtd
Simply Wall St Dividend Rating: ★★★★★☆
Overview: Chiyoda Integre Co., Ltd. is a manufacturer and seller of structural and functional parts for various products, operating both in Japan and internationally, with a market capitalization of ¥33.87 billion.
Operations: Chiyoda Integre Co., Ltd. generates its revenue from the manufacture and sale of structural and functional parts across domestic and international markets.
Dividend Yield: 3.6%
Chiyoda Integre Ltd. offers a dividend yield of 3.57%, placing it among the top 25% of Japanese dividend payers. Despite this, the company's dividend history has been marked by volatility over the past decade. On a positive note, both earnings and cash flows adequately cover its dividends, with payout ratios of 45.4% and 39.6% respectively, suggesting sustainability from current income levels. Recently, Chiyoda Integre announced a share buyback program to repurchase up to ¥1.6 billion worth of shares by November 2024, aiming to enhance shareholder returns amidst strategic adjustments in business operations.
NippiIncorporated
Simply Wall St Dividend Rating: ★★★★★☆
Overview: Nippi Incorporated operates in the production and sale of collagen casings, gelatin, collagen peptides, leather products, cosmetics, health foods, functional polymers, and life science products both domestically and internationally with a market capitalization of ¥19.10 billion.
Operations: Nippi Incorporated generates its revenue from the sales of collagen-based products, leather items, cosmetics, health foods, functional polymers, and life science goods across global markets.
Dividend Yield: 3.3%
Nippi Incorporated maintains a modest dividend yield of 3.31%, slightly below the top quartile of Japanese dividend stocks. Over the past decade, dividends per share have shown stability and growth, supported by a sustainable payout ratio of 24.8% from earnings and an even lower cash payout ratio of 18.5%. These figures suggest that Nippi's dividends are well-protected by both its earnings and cash flow, indicating reliability in its payments to shareholders despite not leading the market in yield.

Make It Happen
Take a closer look at our Top Dividend Stocks list of 393 companies by clicking here.
Already own these companies? Bring clarity to your investment decisions by linking up your portfolio with Simply Wall St, where you can monitor all the vital signs of your stocks effortlessly.
Elevate your portfolio with Simply Wall St, the ultimate app for investors seeking global market coverage.
Ready For A Different Approach?
Explore high-performing small cap companies that haven't yet garnered significant analyst attention.
Fuel your portfolio with companies showing strong growth potential, backed by optimistic outlooks both from analysts and management.
Find companies with promising cash flow potential yet trading below their fair value.
This article by Simply Wall St is general in nature. We provide commentary based on historical data and analyst forecasts only using an unbiased methodology and our articles are not intended to be financial advice. It does not constitute a recommendation to buy or sell any stock, and does not take account of your objectives, or your financial situation. We aim to bring you long-term focused analysis driven by fundamental data. Note that our analysis may not factor in the latest price-sensitive company announcements or qualitative material. Simply Wall St has no position in any stocks mentioned.
Companies discussed in this article include TSE:3431 TSE:6915 and TSE:7932.
Have feedback on this article? Concerned about the content? Get in touch with us directly. Alternatively, email editorial-team@simplywallst.com
