
 Yahoo Finance
 Mogo (TSE:MOGO) investors are sitting on a loss of 47% if they invested a year ago
Investors can approximate the average market return by buying an index fund. While individual stocks can be big winners, plenty more fail to generate satisfactory returns. For example, the Mogo Inc. (TSE:MOGO) share price is down 47% in the last year. That's well below the market return of 23%. We wouldn't rush to judgement on Mogo because we don't have a long term history to look at. The share price has dropped 50% in three months.
Now let's have a look at the company's fundamentals, and see if the long term shareholder return has matched the performance of the underlying business.
See our latest analysis for Mogo
Mogo isn't currently profitable, so most analysts would look to revenue growth to get an idea of how fast the underlying business is growing. When a company doesn't make profits, we'd generally expect to see good revenue growth. That's because it's hard to be confident a company will be sustainable if revenue growth is negligible, and it never makes a profit.
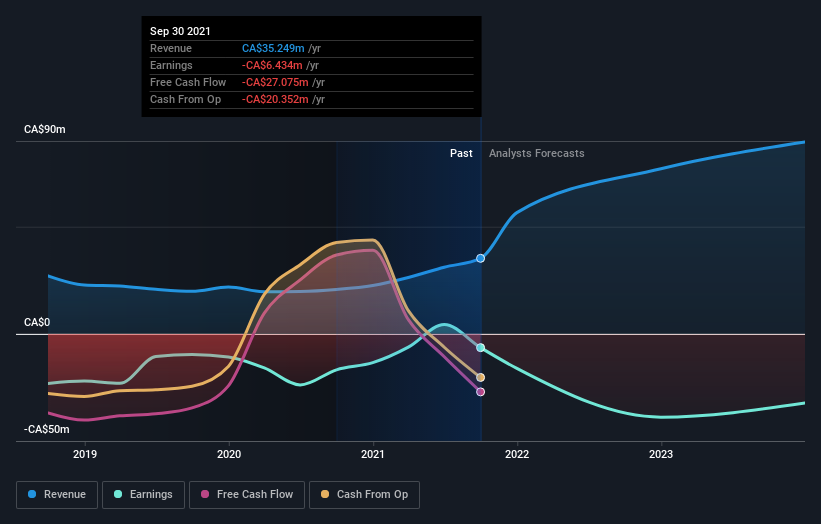
In the last year Mogo saw its revenue grow by 70%. That's well above most other pre-profit companies. The share price drop of 47% over twelve months would be considered disappointing by many, so you might argue the company is getting little credit for its impressive revenue growth. Prima facie, revenue growth like that should be a good thing, so it's worth checking whether losses have stabilized. Our brains have evolved to think in linear fashion, so there's value in learning to recognize exponential growth. We are, in some ways, simply the wisest of the monkeys.
The company's revenue and earnings (over time) are depicted in the image below (click to see the exact numbers).
This free interactive report on Mogo's balance sheet strength is a great place to start, if you want to investigate the stock further.
A Different Perspective
Given that the market gained 23% in the last year, Mogo shareholders might be miffed that they lost 47%. However, keep in mind that even the best stocks will sometimes underperform the market over a twelve month period. Notably, the loss over the last year isn't as bad as the 50% drop in the last three months. This probably signals that the business has recently disappointed shareholders - it will take time to win them back. It's always interesting to track share price performance over the longer term. But to understand Mogo better, we need to consider many other factors. Consider for instance, the ever-present spectre of investment risk. We've identified 4 warning signs with Mogo (at least 2 which are a bit unpleasant) , and understanding them should be part of your investment process.
If you like to buy stocks alongside management, then you might just love this free list of companies. (Hint: insiders have been buying them).
Please note, the market returns quoted in this article reflect the market weighted average returns of stocks that currently trade on CA exchanges.
Have feedback on this article? Concerned about the content? Get in touch with us directly. Alternatively, email editorial-team (at) simplywallst.com.
This article by Simply Wall St is general in nature. We provide commentary based on historical data and analyst forecasts only using an unbiased methodology and our articles are not intended to be financial advice. It does not constitute a recommendation to buy or sell any stock, and does not take account of your objectives, or your financial situation. We aim to bring you long-term focused analysis driven by fundamental data. Note that our analysis may not factor in the latest price-sensitive company announcements or qualitative material. Simply Wall St has no position in any stocks mentioned.
