
 Yahoo Finance
 Will MOGU (NYSE:MOGU) Spend Its Cash Wisely?
Even when a business is losing money, it's possible for shareholders to make money if they buy a good business at the right price. For example, biotech and mining exploration companies often lose money for years before finding success with a new treatment or mineral discovery. But while the successes are well known, investors should not ignore the very many unprofitable companies that simply burn through all their cash and collapse.
Given this risk, we thought we'd take a look at whether MOGU (NYSE:MOGU) shareholders should be worried about its cash burn. For the purposes of this article, cash burn is the annual rate at which an unprofitable company spends cash to fund its growth; its negative free cash flow. First, we'll determine its cash runway by comparing its cash burn with its cash reserves.
See our latest analysis for MOGU
How Long Is MOGU's Cash Runway?
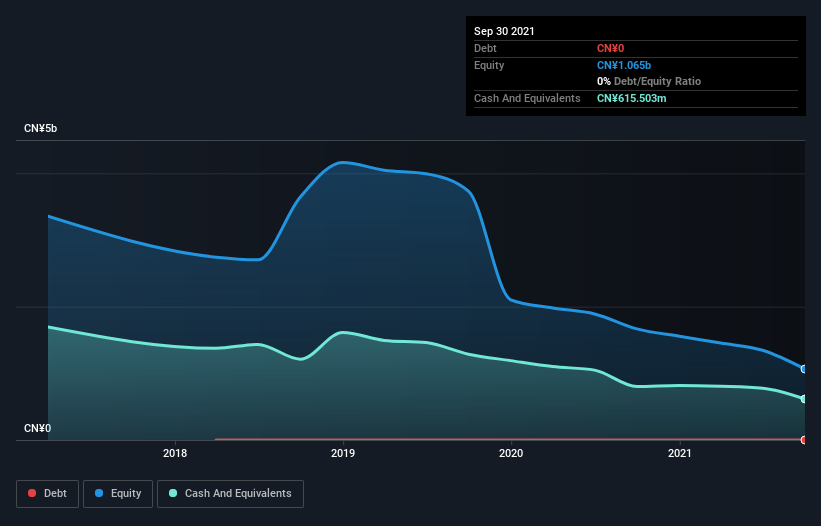
A company's cash runway is the amount of time it would take to burn through its cash reserves at its current cash burn rate. In September 2021, MOGU had CN¥616m in cash, and was debt-free. Looking at the last year, the company burnt through CN¥277m. Therefore, from September 2021 it had 2.2 years of cash runway. Arguably, that's a prudent and sensible length of runway to have. The image below shows how its cash balance has been changing over the last few years.
How Well Is MOGU Growing?
MOGU reduced its cash burn by 6.1% during the last year, which points to some degree of discipline. But the revenue dip of 25% in the same period was a bit concerning. Considering both these metrics, we're a little concerned about how the company is developing. Of course, we've only taken a quick look at the stock's growth metrics, here. This graph of historic earnings and revenue shows how MOGU is building its business over time.
How Easily Can MOGU Raise Cash?
MOGU seems to be in a fairly good position, in terms of cash burn, but we still think it's worthwhile considering how easily it could raise more money if it wanted to. Companies can raise capital through either debt or equity. Commonly, a business will sell new shares in itself to raise cash and drive growth. By comparing a company's annual cash burn to its total market capitalisation, we can estimate roughly how many shares it would have to issue in order to run the company for another year (at the same burn rate).
MOGU's cash burn of CN¥277m is about 116% of its CN¥239m market capitalisation. That suggests the company may have some funding difficulties, and we'd be very wary of the stock.
How Risky Is MOGU's Cash Burn Situation?
On this analysis of MOGU's cash burn, we think its cash runway was reassuring, while its cash burn relative to its market cap has us a bit worried. Summing up, we think the MOGU's cash burn is a risk, based on the factors we mentioned in this article. An in-depth examination of risks revealed 2 warning signs for MOGU that readers should think about before committing capital to this stock.
Of course MOGU may not be the best stock to buy. So you may wish to see this free collection of companies boasting high return on equity, or this list of stocks that insiders are buying.
Have feedback on this article? Concerned about the content? Get in touch with us directly. Alternatively, email editorial-team (at) simplywallst.com.
This article by Simply Wall St is general in nature. We provide commentary based on historical data and analyst forecasts only using an unbiased methodology and our articles are not intended to be financial advice. It does not constitute a recommendation to buy or sell any stock, and does not take account of your objectives, or your financial situation. We aim to bring you long-term focused analysis driven by fundamental data. Note that our analysis may not factor in the latest price-sensitive company announcements or qualitative material. Simply Wall St has no position in any stocks mentioned.
