
 Yahoo Finance
 Momo's (NASDAQ:MOMO) Stock Price Has Reduced 63% In The Past Year
Investing in stocks comes with the risk that the share price will fall. Anyone who held Momo Inc. (NASDAQ:MOMO) over the last year knows what a loser feels like. The share price is down a hefty 63% in that time. Notably, shareholders had a tough run over the longer term, too, with a drop of 48% in the last three years. More recently, the share price has dropped a further 16% in a month. Importantly, this could be a market reaction to the recently released financial results. You can check out the latest numbers in our company report.
View our latest analysis for Momo
While markets are a powerful pricing mechanism, share prices reflect investor sentiment, not just underlying business performance. One flawed but reasonable way to assess how sentiment around a company has changed is to compare the earnings per share (EPS) with the share price.
Unhappily, Momo had to report a 3.5% decline in EPS over the last year. The share price decline of 63% is actually more than the EPS drop. This suggests the EPS fall has made some shareholders are more nervous about the business. The P/E ratio of 7.25 also points to the negative market sentiment.
The graphic below depicts how EPS has changed over time (unveil the exact values by clicking on the image).
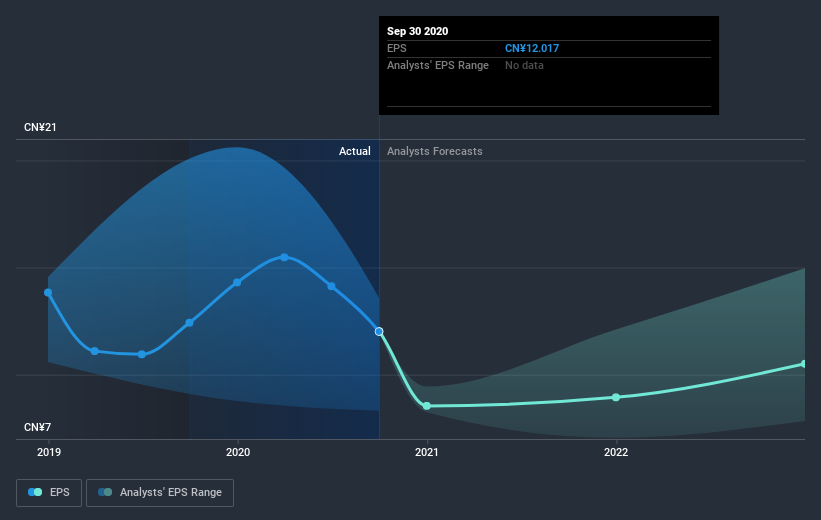
Dive deeper into Momo's key metrics by checking this interactive graph of Momo's earnings, revenue and cash flow.
A Different Perspective
Investors in Momo had a tough year, with a total loss of 62% (including dividends), against a market gain of about 22%. Even the share prices of good stocks drop sometimes, but we want to see improvements in the fundamental metrics of a business, before getting too interested. Regrettably, last year's performance caps off a bad run, with the shareholders facing a total loss of 2% per year over five years. Generally speaking long term share price weakness can be a bad sign, though contrarian investors might want to research the stock in hope of a turnaround. While it is well worth considering the different impacts that market conditions can have on the share price, there are other factors that are even more important. For instance, we've identified 1 warning sign for Momo that you should be aware of.
For those who like to find winning investments this free list of growing companies with recent insider purchasing, could be just the ticket.
Please note, the market returns quoted in this article reflect the market weighted average returns of stocks that currently trade on US exchanges.
This article by Simply Wall St is general in nature. It does not constitute a recommendation to buy or sell any stock, and does not take account of your objectives, or your financial situation. We aim to bring you long-term focused analysis driven by fundamental data. Note that our analysis may not factor in the latest price-sensitive company announcements or qualitative material. Simply Wall St has no position in any stocks mentioned.
Have feedback on this article? Concerned about the content? Get in touch with us directly. Alternatively, email editorial-team@simplywallst.com.
