
 Yahoo Finance
 Mondelez International (NASDAQ:MDLZ) Is Looking To Continue Growing Its Returns On Capital
If we want to find a potential multi-bagger, often there are underlying trends that can provide clues. Ideally, a business will show two trends; firstly a growing return on capital employed (ROCE) and secondly, an increasing amount of capital employed. This shows us that it's a compounding machine, able to continually reinvest its earnings back into the business and generate higher returns. With that in mind, we've noticed some promising trends at Mondelez International (NASDAQ:MDLZ) so let's look a bit deeper.
What Is Return On Capital Employed (ROCE)?
For those who don't know, ROCE is a measure of a company's yearly pre-tax profit (its return), relative to the capital employed in the business. To calculate this metric for Mondelez International, this is the formula:
Return on Capital Employed = Earnings Before Interest and Tax (EBIT) ÷ (Total Assets - Current Liabilities)
0.11 = US$6.0b ÷ (US$71b - US$19b) (Based on the trailing twelve months to December 2023).
Thus, Mondelez International has an ROCE of 11%. By itself that's a normal return on capital and it's in line with the industry's average returns of 11%.
View our latest analysis for Mondelez International
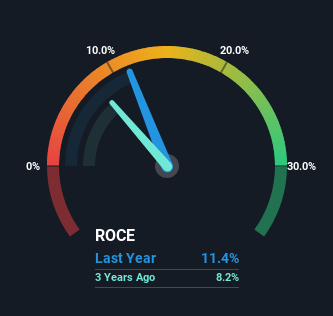
Above you can see how the current ROCE for Mondelez International compares to its prior returns on capital, but there's only so much you can tell from the past. If you'd like to see what analysts are forecasting going forward, you should check out our free analyst report for Mondelez International .
What Can We Tell From Mondelez International's ROCE Trend?
Mondelez International has not disappointed with their ROCE growth. More specifically, while the company has kept capital employed relatively flat over the last five years, the ROCE has climbed 39% in that same time. Basically the business is generating higher returns from the same amount of capital and that is proof that there are improvements in the company's efficiencies. On that front, things are looking good so it's worth exploring what management has said about growth plans going forward.
The Key Takeaway
As discussed above, Mondelez International appears to be getting more proficient at generating returns since capital employed has remained flat but earnings (before interest and tax) are up. And investors seem to expect more of this going forward, since the stock has rewarded shareholders with a 51% return over the last five years. With that being said, we still think the promising fundamentals mean the company deserves some further due diligence.
On a separate note, we've found 1 warning sign for Mondelez International you'll probably want to know about.
While Mondelez International isn't earning the highest return, check out this free list of companies that are earning high returns on equity with solid balance sheets.
Have feedback on this article? Concerned about the content? Get in touch with us directly. Alternatively, email editorial-team (at) simplywallst.com.
This article by Simply Wall St is general in nature. We provide commentary based on historical data and analyst forecasts only using an unbiased methodology and our articles are not intended to be financial advice. It does not constitute a recommendation to buy or sell any stock, and does not take account of your objectives, or your financial situation. We aim to bring you long-term focused analysis driven by fundamental data. Note that our analysis may not factor in the latest price-sensitive company announcements or qualitative material. Simply Wall St has no position in any stocks mentioned.
