
 Yahoo Finance
 Moneysupermarket.com Group PLC (LON:MONY): Financial Strength Analysis

Want to participate in a short research study? Help shape the future of investing tools and you could win a $250 gift card!
Small-caps and large-caps are wildly popular among investors, however, mid-cap stocks, such as Moneysupermarket.com Group PLC (LON:MONY), with a market capitalization of UK£2.2b, rarely draw their attention from the investing community. Despite this, the two other categories have lagged behind the risk-adjusted returns of commonly ignored mid-cap stocks. Today we will look at MONY’s financial liquidity and debt levels, which are strong indicators for whether the company can weather economic downturns or fund strategic acquisitions for future growth. Note that this commentary is very high-level and solely focused on financial health, so I suggest you dig deeper yourself into MONY here.
See our latest analysis for Moneysupermarket.com Group
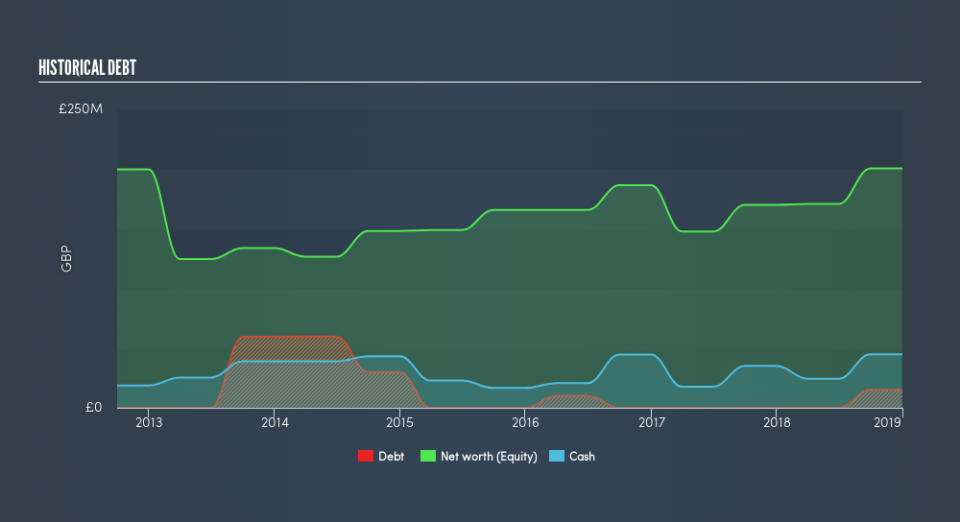
Does MONY Produce Much Cash Relative To Its Debt?
MONY has increased its debt level by about UK£15m over the last 12 months , which is mainly comprised of near term debt. With this increase in debt, the current cash and short-term investment levels stands at UK£45m to keep the business going. On top of this, MONY has produced cash from operations of UK£107m in the last twelve months, resulting in an operating cash to total debt ratio of 711%, indicating that MONY’s operating cash is sufficient to cover its debt.
Does MONY’s liquid assets cover its short-term commitments?
With current liabilities at UK£78m, it appears that the company has maintained a safe level of current assets to meet its obligations, with the current ratio last standing at 1.21x. The current ratio is the number you get when you divide current assets by current liabilities. For Online Retail companies, this ratio is within a sensible range since there is a bit of a cash buffer without leaving too much capital in a low-return environment.
Can MONY service its debt comfortably?
With debt at 7.5% of equity, MONY may be thought of as having low leverage. MONY is not taking on too much debt commitment, which can be restrictive and risky for equity-holders. We can test if MONY’s debt levels are sustainable by measuring interest payments against earnings of a company. Ideally, earnings before interest and tax (EBIT) should cover net interest by at least three times. For MONY, the ratio of 127x suggests that interest is comfortably covered, which means that debtors may be willing to loan the company more money, giving MONY ample headroom to grow its debt facilities.
Next Steps:
MONY’s high cash coverage and low debt levels indicate its ability to utilise its borrowings efficiently in order to generate ample cash flow. Furthermore, the company exhibits proper management of current assets and upcoming liabilities. This is only a rough assessment of financial health, and I'm sure MONY has company-specific issues impacting its capital structure decisions. You should continue to research Moneysupermarket.com Group to get a better picture of the stock by looking at:
Future Outlook: What are well-informed industry analysts predicting for MONY’s future growth? Take a look at our free research report of analyst consensus for MONY’s outlook.
Valuation: What is MONY worth today? Is the stock undervalued, even when its growth outlook is factored into its intrinsic value? The intrinsic value infographic in our free research report helps visualize whether MONY is currently mispriced by the market.
Other High-Performing Stocks: Are there other stocks that provide better prospects with proven track records? Explore our free list of these great stocks here.
We aim to bring you long-term focused research analysis driven by fundamental data. Note that our analysis may not factor in the latest price-sensitive company announcements or qualitative material.
If you spot an error that warrants correction, please contact the editor at editorial-team@simplywallst.com. This article by Simply Wall St is general in nature. It does not constitute a recommendation to buy or sell any stock, and does not take account of your objectives, or your financial situation. Simply Wall St has no position in the stocks mentioned. Thank you for reading.
