
 Yahoo Finance
 Morgan Advanced Materials (LON:MGAM) Has More To Do To Multiply In Value Going Forward
If we want to find a potential multi-bagger, often there are underlying trends that can provide clues. Amongst other things, we'll want to see two things; firstly, a growing return on capital employed (ROCE) and secondly, an expansion in the company's amount of capital employed. Ultimately, this demonstrates that it's a business that is reinvesting profits at increasing rates of return. In light of that, when we looked at Morgan Advanced Materials (LON:MGAM) and its ROCE trend, we weren't exactly thrilled.
Return On Capital Employed (ROCE): What is it?
If you haven't worked with ROCE before, it measures the 'return' (pre-tax profit) a company generates from capital employed in its business. Analysts use this formula to calculate it for Morgan Advanced Materials:
Return on Capital Employed = Earnings Before Interest and Tax (EBIT) ÷ (Total Assets - Current Liabilities)
0.13 = UK£84m ÷ (UK£931m - UK£280m) (Based on the trailing twelve months to December 2020).
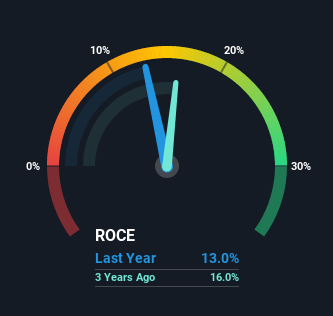
So, Morgan Advanced Materials has an ROCE of 13%. On its own, that's a standard return, however it's much better than the 8.9% generated by the Machinery industry.
View our latest analysis for Morgan Advanced Materials
In the above chart we have measured Morgan Advanced Materials' prior ROCE against its prior performance, but the future is arguably more important. If you'd like to see what analysts are forecasting going forward, you should check out our free report for Morgan Advanced Materials.
So How Is Morgan Advanced Materials' ROCE Trending?
Things have been pretty stable at Morgan Advanced Materials, with its capital employed and returns on that capital staying somewhat the same for the last five years. This tells us the company isn't reinvesting in itself, so it's plausible that it's past the growth phase. With that in mind, unless investment picks up again in the future, we wouldn't expect Morgan Advanced Materials to be a multi-bagger going forward. With fewer investment opportunities, it makes sense that Morgan Advanced Materials has been paying out a decent 34% of its earnings to shareholders. Unless businesses have highly compelling growth opportunities, they'll typically return some money to shareholders.
In Conclusion...
In summary, Morgan Advanced Materials isn't compounding its earnings but is generating stable returns on the same amount of capital employed. Although the market must be expecting these trends to improve because the stock has gained 78% over the last five years. Ultimately, if the underlying trends persist, we wouldn't hold our breath on it being a multi-bagger going forward.
One final note, you should learn about the 2 warning signs we've spotted with Morgan Advanced Materials (including 1 which is a bit unpleasant) .
If you want to search for solid companies with great earnings, check out this free list of companies with good balance sheets and impressive returns on equity.
This article by Simply Wall St is general in nature. It does not constitute a recommendation to buy or sell any stock, and does not take account of your objectives, or your financial situation. We aim to bring you long-term focused analysis driven by fundamental data. Note that our analysis may not factor in the latest price-sensitive company announcements or qualitative material. Simply Wall St has no position in any stocks mentioned.
Have feedback on this article? Concerned about the content? Get in touch with us directly. Alternatively, email editorial-team (at) simplywallst.com.
