Morgan Stanley (MS) Q3 Earnings Top on Bond Trading, Advisory
Better-than-expected capital markets performance drove Morgan Stanley’s MS third-quarter 2019 adjusted earnings of $1.21 per share, which outpaced the Zacks Consensus Estimate of $1.10. Also, the figure increased 3% from the year-ago quarter. Results in the reported quarter excluded net discrete tax benefit.
Shares of Morgan Stanley rallied more than 4% in pre-market following an unexpected improvement in bond trading income. The stock’s price performance after the full day’s trading will give a better picture.
Morgan Stanley recorded a rise in trading and investment banking revenues. Specifically, fixed income trading income jumped 21%, while equity trading income witnessed a fall of 1%. Overall trading revenues grew 10%.
Now coming to investment banking performance, advisory fees increased 8% and underwriting income was up 4%. Notably, improvement in underwriting income was driven by higher debt underwriting revenues (up 15%), partially offset by 9% fall in equity underwriting fees.
Further, higher net interest income, driven by rise in loan balance, supported the top line.
However, operating expenses witnessed a rise.
Net income applicable to Morgan Stanley was $2.17 billion, up 3%.
Trading, Investment Banking Aid Revenues, Costs Rise
Net revenues amounted to $10.03 billion, up 2% from the prior-year quarter. Also, the top line beat the Zacks Consensus Estimate of $9.68 billion.
Net interest income was $1.22 billion, up 30% from the year-ago quarter. This was largely due to a rise in interest income, partially offset by higher interest expenses.
Total non-interest revenues of $8.81 billion dipped 1% year over year.
Total non-interest expenses were $7.32 billion, up 4%.
Decent Segmental Performance
Institutional Securities: Pre-tax income from continuing operations was $1.31 billion, decreasing 16% year over year. Net revenues were $5.02 billion, up 2%. The rise was mainly driven by higher trading income and investment banking revenues, partially offset by significant decline in investment revenues.
Wealth Management: Pre-tax income from continuing operations totaled $1.24 billion, up 4%. Net revenues were $4.36 billion, down 1% year over year as decline in transactional revenues and lower net interest income were partially offset by higher asset management revenues.
Investment Management: Pre-tax income from continuing operations was $165 million, surging 62% from the year-ago quarter. Net revenues were $764 million, up 17%. The increase was mainly driven by rise in asset management fees and investment revenues.
As of Sep 30, 2019, total assets under management or supervision were $507 billion, up 8% on a year-over-year basis.
Strong Capital Position
As of Sep 30, 2019, book value per share was $45.49, up from $40.67 as of Sep 30, 2018. Tangible book value per share was $39.73, up from $35.50.
Morgan Stanley’s Tier 1 capital ratio was 18.4% compared with 19.0% in the year-ago quarter. Tier 1 common equity ratio was 16.2%, down from 16.7%.
Share Repurchase Update
During the reported quarter, Morgan Stanley repurchased shares worth $1.5 billion. This was part of the company's 2019 capital plan.
Our Viewpoint
Morgan Stanley’s focus on less capital-incentive operations like wealth management is commendable. However, mounting costs pose a concern.
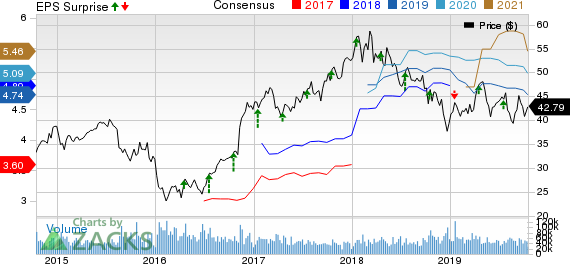
Morgan Stanley Price, Consensus and EPS Surprise

Morgan Stanley price-consensus-eps-surprise-chart | Morgan Stanley Quote
Currently, Morgan Stanley carries a Zacks Rank #3 (Hold). You can see the complete list of today’s Zacks #1 Rank (Strong Buy) stocks here.
Performance of Other Big Banks
Improved capital market performance drove Bank of America’s BAC adjusted third-quarter 2019 earnings of 75 cents per share, which outpaced the Zacks Consensus Estimate of 50 cents. Also, the figure was up 14% from the prior-year quarter.
Better-than-expected underwriting business performance, rise in mortgage banking fees and higher bond trading income drove JPMorgan’s JPM third-quarter 2019 earnings of $2.68 per share, which outpaced the Zacks Consensus Estimate of $2.44.
Citigroup C delivered a positive earnings surprise of 1% in third-quarter 2019, backed by improved investment banking performance. Adjusted earnings per share of $1.98 outpaced the Zacks Consensus Estimate of $1.96. Also, earnings climbed 20% year over year.
7 Best Stocks for the Next 30 Days
Just released: Experts distill 7 elite stocks from the current list of 220 Zacks Rank #1 Strong Buys. They deem these tickers “Most Likely for Early Price Pops.”
Since 1988, the full list has beaten the market more than 2X over with an average gain of +24.50% per year. So be sure to give these hand-picked 7 your immediate attention.
See them now >>
Want the latest recommendations from Zacks Investment Research? Today, you can download 7 Best Stocks for the Next 30 Days. Click to get this free report
Bank of America Corporation (BAC) : Free Stock Analysis Report
Citigroup Inc. (C) : Free Stock Analysis Report
JPMorgan Chase & Co. (JPM) : Free Stock Analysis Report
Morgan Stanley (MS) : Free Stock Analysis Report
To read this article on Zacks.com click here.
Zacks Investment Research

 Yahoo Finance