
 Yahoo Finance
 Morrisons profits slashed in half after £290m Covid-19 costs
Morrisons has revealed that profits were cut by more than half over the past year after it was hit by £290 million in pandemic-related costs.
The supermarket group told investors that profits before tax and exceptional costs slid by 50.7% to £201 million for the year to January 31.
The Bradford-based retailer said it was impacted by higher-than-expected pandemic costs after a recent increase in absences, as well as the £230 million impact of handing its business rates relief back to the Treasury.
Group like-for-like sales, excluding fuel and VAT, jumped by 8.6% as it was buoyed by strong grocery demand, with 9% growth in a strong final quarter.
Morrisons said online sales tripled during the year as its capacity jumped five-fold.
It said online and wholesale operations are both profitable and it expects these to continue to improve.
The company expects to post higher profits for the new financial year and has seen “strong trading” since it began in February.
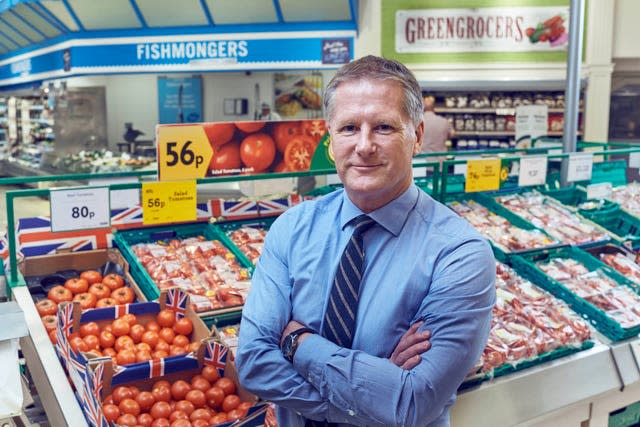
Chief executive David Potts told reporters he wears the halving of its profits as a “badge of honour” as it was impacted by costs related to staff absences, hiring temporary workers, security and store safety measures.
“If we hadn’t made a profit it would have been OK as we did the right thing by our colleagues and customers,” he said.
He provided the update as the retailer said it would extend its 10% discount scheme for NHS workers until the end of the year.
Andrew Higginson, chairman of the company, said: “This has been a year where Morrisons’ resilience has been severely tested and I could not be more proud of the way the whole business has met that test.
“As we look forward to brighter times ahead, Morrisons is developing into a stronger, better business with deeper and closer relationships with our customers and the communities we serve.”
Mr Potts added: “I’m pleased with the greater recognition, warmth and affection for the Morrisons brand from all corners of the nation, following a year like no other.
“We must now look forward with hope towards better times for all, and we’re confident we can take our strong momentum into the new year, targeting profit growth and significantly lower net debt during 2021-22.”
John Moore, senior investment manager at Brewin Dolphin, said: “This time last year many people expected supermarkets to be among the businesses that emerged from Covid-19 stronger – even as ‘winners’ – but today’s results from Morrisons underline the complexities that challenged this view.
“The supermarket group has taken on a number of exceptional costs and these have contributed significantly to a halving of profits.
“Some of them come from Morrisons’ decision to do the right thing, which is a testament to its culture – but waiving rates relief, paying staff a bonus, and contributing to food banks should also help its standing with customers.”
