
 Yahoo Finance
 The Moss Bros Group (LON:MOSB) Share Price Is Down 80% So Some Shareholders Are Rather Upset

Moss Bros Group plc (LON:MOSB) shareholders should be happy to see the share price up 12% in the last month. But the last three years have seen a terrible decline. The share price has sunk like a leaky ship, down 80% in that time. Arguably, the recent bounce is to be expected after such a bad drop. But the more important question is whether the underlying business can justify a higher price still.
We really hope anyone holding through that price crash has a diversified portfolio. Even when you lose money, you don't have to lose the lesson.
See our latest analysis for Moss Bros Group
While markets are a powerful pricing mechanism, share prices reflect investor sentiment, not just underlying business performance. One way to examine how market sentiment has changed over time is to look at the interaction between a company's share price and its earnings per share (EPS).
Moss Bros Group saw its share price decline over the three years in which its EPS also dropped, falling to a loss. Due to the loss, it's not easy to use EPS as a reliable guide to the business. But it's safe to say we'd generally expect the share price to be lower as a result!
The graphic below depicts how EPS has changed over time (unveil the exact values by clicking on the image).
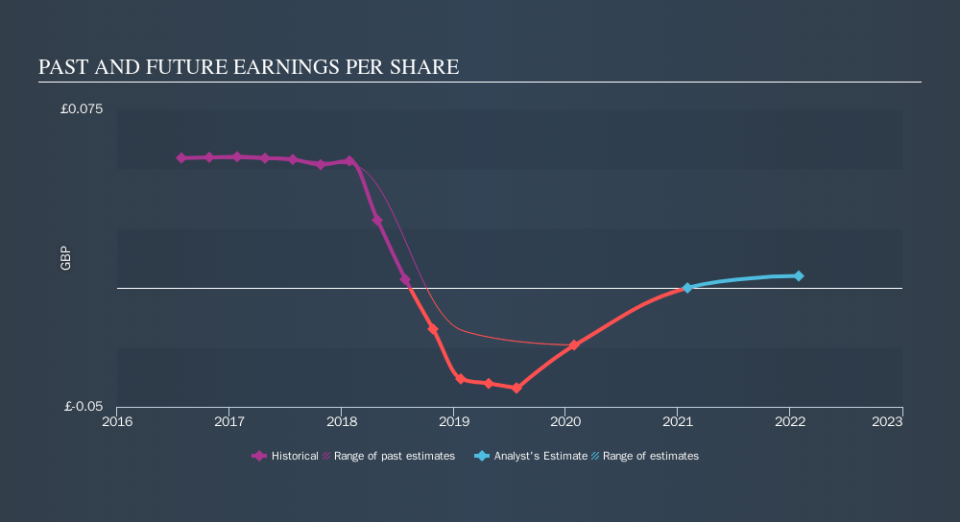
Dive deeper into Moss Bros Group's key metrics by checking this interactive graph of Moss Bros Group's earnings, revenue and cash flow.
What about the Total Shareholder Return (TSR)?
We'd be remiss not to mention the difference between Moss Bros Group's total shareholder return (TSR) and its share price return. The TSR attempts to capture the value of dividends (as if they were reinvested) as well as any spin-offs or discounted capital raisings offered to shareholders. Dividends have been really beneficial for Moss Bros Group shareholders, and that cash payout explains why its total shareholder loss of 77%, over the last 3 years, isn't as bad as the share price return.
A Different Perspective
While the broader market gained around 9.2% in the last year, Moss Bros Group shareholders lost 36%. However, keep in mind that even the best stocks will sometimes underperform the market over a twelve month period. Regrettably, last year's performance caps off a bad run, with the shareholders facing a total loss of 21% per year over five years. Generally speaking long term share price weakness can be a bad sign, though contrarian investors might want to research the stock in hope of a turnaround. You could get a better understanding of Moss Bros Group's growth by checking out this more detailed historical graph of earnings, revenue and cash flow.
We will like Moss Bros Group better if we see some big insider buys. While we wait, check out this free list of growing companies with considerable, recent, insider buying.
Please note, the market returns quoted in this article reflect the market weighted average returns of stocks that currently trade on GB exchanges.
We aim to bring you long-term focused research analysis driven by fundamental data. Note that our analysis may not factor in the latest price-sensitive company announcements or qualitative material.
If you spot an error that warrants correction, please contact the editor at editorial-team@simplywallst.com. This article by Simply Wall St is general in nature. It does not constitute a recommendation to buy or sell any stock, and does not take account of your objectives, or your financial situation. Simply Wall St has no position in the stocks mentioned. Thank you for reading.
