
 Yahoo Finance
 Should Motherson Sumi Systems Limited’s (NSE:MOTHERSUMI) Recent Earnings Worry You?

When Motherson Sumi Systems Limited’s (NSE:MOTHERSUMI) announced its latest earnings (30 June 2018), I wanted to understand how these figures stacked up against its past performance. The two benchmarks I used were Motherson Sumi Systems’s average earnings over the past couple of years, and its industry performance. These are useful yardsticks to help me gauge whether or not MOTHERSUMI actually performed well. Below is a quick commentary on how I see MOTHERSUMI has performed.
View our latest analysis for Motherson Sumi Systems
How Well Did MOTHERSUMI Perform?
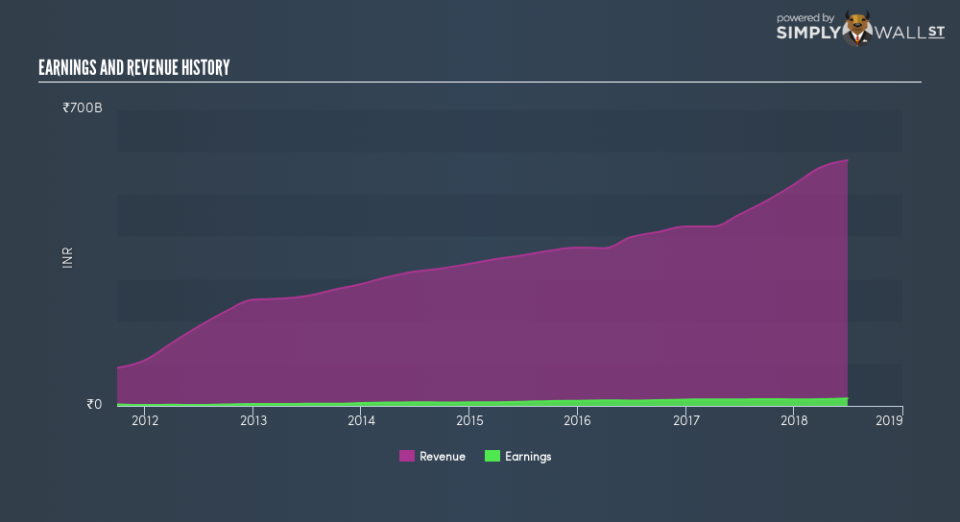
MOTHERSUMI’s trailing twelve-month earnings (from 30 June 2018) of ₹17.62b has jumped 15.20% compared to the previous year. However, this one-year growth rate has been lower than its average earnings growth rate over the past 5 years of 25.65%, indicating the rate at which MOTHERSUMI is growing has slowed down. What could be happening here? Well, let’s examine what’s occurring with margins and whether the entire industry is experiencing the hit as well.
Over the last few years, revenue growth has been lagging behind which indicates that Motherson Sumi Systems’s bottom line has been driven by unsustainable cost-cutting. Scanning growth from a sector-level, the IN auto components industry has been growing its average earnings by double-digit 29.52% over the past year, and 13.60% over the past half a decade. This growth is a median of profitable companies of 25 Auto Components companies in IN including Rasandik Engineering Industries India, Precision Camshafts and Precision Camshafts. This means whatever uplift the industry is profiting from, Motherson Sumi Systems has not been able to reap as much as its average peer.
In terms of returns from investment, Motherson Sumi Systems has fallen short of achieving a 20% return on equity (ROE), recording 19.71% instead. Furthermore, its return on assets (ROA) of 5.10% is below the IN Auto Components industry of 8.07%, indicating Motherson Sumi Systems’s are utilized less efficiently. And finally, its return on capital (ROC), which also accounts for Motherson Sumi Systems’s debt level, has declined over the past 3 years from 22.14% to 16.57%.
What does this mean?
While past data is useful, it doesn’t tell the whole story. Positive growth and profitability are what investors like to see in a company’s track record, but how do we properly assess sustainability? You should continue to research Motherson Sumi Systems to get a better picture of the stock by looking at:
Future Outlook: What are well-informed industry analysts predicting for MOTHERSUMI’s future growth? Take a look at our free research report of analyst consensus for MOTHERSUMI’s outlook.
Financial Health: Are MOTHERSUMI’s operations financially sustainable? Balance sheets can be hard to analyze, which is why we’ve done it for you. Check out our financial health checks here.
Other High-Performing Stocks: Are there other stocks that provide better prospects with proven track records? Explore our free list of these great stocks here.
NB: Figures in this article are calculated using data from the trailing twelve months from 30 June 2018. This may not be consistent with full year annual report figures.
To help readers see past the short term volatility of the financial market, we aim to bring you a long-term focused research analysis purely driven by fundamental data. Note that our analysis does not factor in the latest price-sensitive company announcements.
The author is an independent contributor and at the time of publication had no position in the stocks mentioned. For errors that warrant correction please contact the editor at editorial-team@simplywallst.com.
