
 Yahoo Finance
 Motorola Solutions (NYSE:MSI) Could Become A Multi-Bagger
Did you know there are some financial metrics that can provide clues of a potential multi-bagger? Firstly, we'll want to see a proven return on capital employed (ROCE) that is increasing, and secondly, an expanding base of capital employed. Put simply, these types of businesses are compounding machines, meaning they are continually reinvesting their earnings at ever-higher rates of return. With that in mind, the ROCE of Motorola Solutions (NYSE:MSI) looks great, so lets see what the trend can tell us.
Return On Capital Employed (ROCE): What Is It?
For those that aren't sure what ROCE is, it measures the amount of pre-tax profits a company can generate from the capital employed in its business. Analysts use this formula to calculate it for Motorola Solutions:
Return on Capital Employed = Earnings Before Interest and Tax (EBIT) ÷ (Total Assets - Current Liabilities)
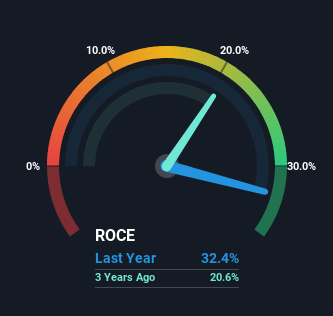
0.32 = US$2.5b ÷ (US$13b - US$5.7b) (Based on the trailing twelve months to December 2023).
So, Motorola Solutions has an ROCE of 32%. That's a fantastic return and not only that, it outpaces the average of 8.0% earned by companies in a similar industry.
Check out our latest analysis for Motorola Solutions
Above you can see how the current ROCE for Motorola Solutions compares to its prior returns on capital, but there's only so much you can tell from the past. If you're interested, you can view the analysts predictions in our free analyst report for Motorola Solutions .
How Are Returns Trending?
Investors would be pleased with what's happening at Motorola Solutions. The data shows that returns on capital have increased substantially over the last five years to 32%. The amount of capital employed has increased too, by 20%. So we're very much inspired by what we're seeing at Motorola Solutions thanks to its ability to profitably reinvest capital.
On a side note, we noticed that the improvement in ROCE appears to be partly fueled by an increase in current liabilities. The current liabilities has increased to 43% of total assets, so the business is now more funded by the likes of its suppliers or short-term creditors. Given it's pretty high ratio, we'd remind investors that having current liabilities at those levels can bring about some risks in certain businesses.
What We Can Learn From Motorola Solutions' ROCE
To sum it up, Motorola Solutions has proven it can reinvest in the business and generate higher returns on that capital employed, which is terrific. Since the stock has returned a staggering 156% to shareholders over the last five years, it looks like investors are recognizing these changes. In light of that, we think it's worth looking further into this stock because if Motorola Solutions can keep these trends up, it could have a bright future ahead.
One more thing to note, we've identified 1 warning sign with Motorola Solutions and understanding it should be part of your investment process.
If you'd like to see other companies earning high returns, check out our free list of companies earning high returns with solid balance sheets here.
Have feedback on this article? Concerned about the content? Get in touch with us directly. Alternatively, email editorial-team (at) simplywallst.com.
This article by Simply Wall St is general in nature. We provide commentary based on historical data and analyst forecasts only using an unbiased methodology and our articles are not intended to be financial advice. It does not constitute a recommendation to buy or sell any stock, and does not take account of your objectives, or your financial situation. We aim to bring you long-term focused analysis driven by fundamental data. Note that our analysis may not factor in the latest price-sensitive company announcements or qualitative material. Simply Wall St has no position in any stocks mentioned.
