MRC Global's (NYSE:MRC) one-year earnings growth trails the 57% YoY shareholder returns
Passive investing in index funds can generate returns that roughly match the overall market. But you can significantly boost your returns by picking above-average stocks. To wit, the MRC Global Inc. (NYSE:MRC) share price is 57% higher than it was a year ago, much better than the market return of around 26% (not including dividends) in the same period. That's a solid performance by our standards! The longer term returns have not been as good, with the stock price only 16% higher than it was three years ago.
On the back of a solid 7-day performance, let's check what role the company's fundamentals have played in driving long term shareholder returns.
Check out our latest analysis for MRC Global
While the efficient markets hypothesis continues to be taught by some, it has been proven that markets are over-reactive dynamic systems, and investors are not always rational. One imperfect but simple way to consider how the market perception of a company has shifted is to compare the change in the earnings per share (EPS) with the share price movement.
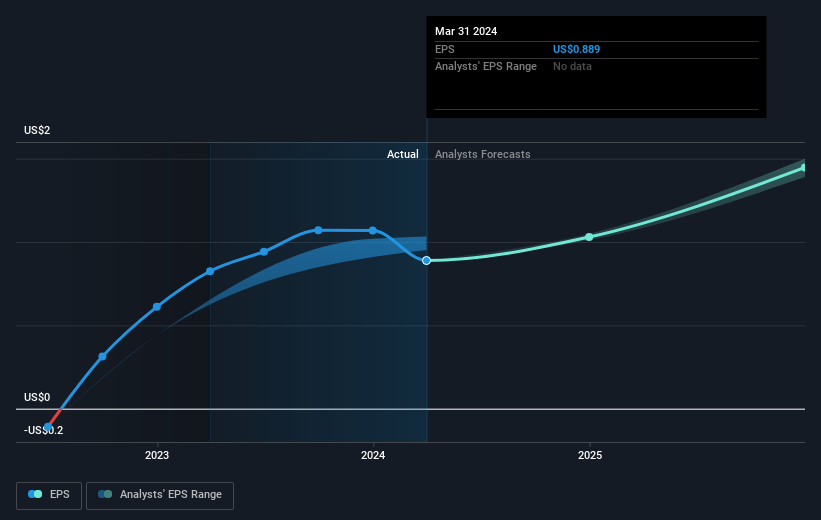
During the last year MRC Global grew its earnings per share (EPS) by 7.8%. The share price gain of 57% certainly outpaced the EPS growth. This indicates that the market is now more optimistic about the stock.
The image below shows how EPS has tracked over time (if you click on the image you can see greater detail).
We know that MRC Global has improved its bottom line over the last three years, but what does the future have in store? Take a more thorough look at MRC Global's financial health with this free report on its balance sheet.
A Different Perspective
It's nice to see that MRC Global shareholders have received a total shareholder return of 57% over the last year. There's no doubt those recent returns are much better than the TSR loss of 3% per year over five years. This makes us a little wary, but the business might have turned around its fortunes. Before forming an opinion on MRC Global you might want to consider these 3 valuation metrics.
Of course MRC Global may not be the best stock to buy. So you may wish to see this free collection of growth stocks.
Please note, the market returns quoted in this article reflect the market weighted average returns of stocks that currently trade on American exchanges.
Have feedback on this article? Concerned about the content? Get in touch with us directly. Alternatively, email editorial-team (at) simplywallst.com.
This article by Simply Wall St is general in nature. We provide commentary based on historical data and analyst forecasts only using an unbiased methodology and our articles are not intended to be financial advice. It does not constitute a recommendation to buy or sell any stock, and does not take account of your objectives, or your financial situation. We aim to bring you long-term focused analysis driven by fundamental data. Note that our analysis may not factor in the latest price-sensitive company announcements or qualitative material. Simply Wall St has no position in any stocks mentioned.

 Yahoo Finance
