
 Yahoo Finance
 Is MTU Aero Engines AG’s (ETR:MTX) PE Ratio A Signal To Sell For Investors?

I am writing today to help inform people who are new to the stock market and want to begin learning about how to value company based on its current earnings and what are the drawbacks of this method.
MTU Aero Engines AG (ETR:MTX) is currently trading at a trailing P/E of 25, which is close to the industry average of 24.5. While this might not seem positive, it is important to understand the assumptions behind the P/E ratio before you make any investment decisions. In this article, I will deconstruct the P/E ratio and highlight what you need to be careful of when using the P/E ratio.
View our latest analysis for MTU Aero Engines
Demystifying the P/E ratio
The P/E ratio is one of many ratios used in relative valuation. It compares a stock’s price per share to the stock’s earnings per share. A more intuitive way of understanding the P/E ratio is to think of it as how much investors are paying for each dollar of the company’s earnings.
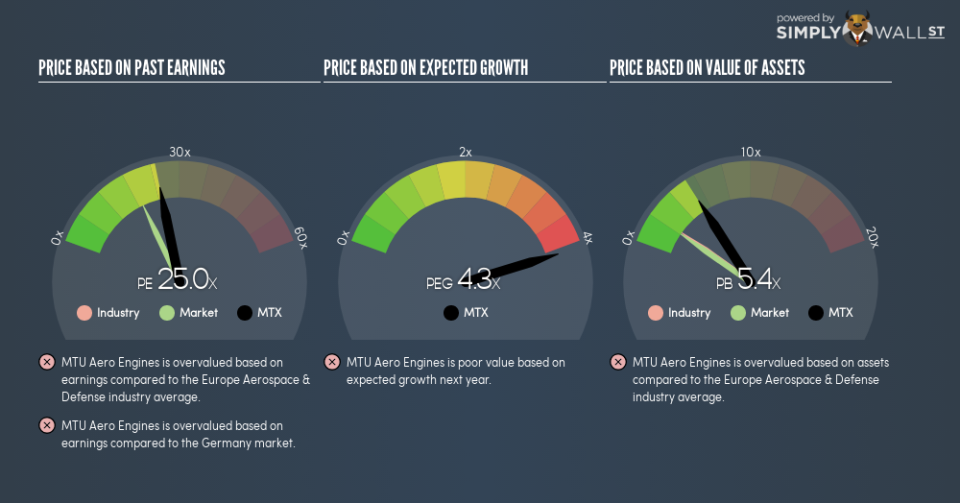
P/E Calculation for MTX
Price-Earnings Ratio = Price per share ÷ Earnings per share
MTX Price-Earnings Ratio = €191.8 ÷ €7.674 = 25x
The P/E ratio itself doesn’t tell you a lot; however, it becomes very insightful when you compare it with other similar companies. We want to compare the stock’s P/E ratio to the average of companies that have similar characteristics as MTX, such as size and country of operation. One way of gathering a peer group is to use firms in the same industry, which is what I’ll do. MTU Aero Engines AG (ETR:MTX) trades on a trailing P/E of 25. This isn’t too far from the industry average (which is 24.5). Since the Aerospace & Defense sector in DE is relatively small, I’ve included similar companies in the wider region in order to get a better idea of the multiple, which is a median of profitable companies of companies such as Vectrus, Bluedrop Performance Learning and Rolls-Royce Holdings. You can think of it like this: the market is suggesting that MTX has similar prospects to its peers in the same industry.
A few caveats
Before you jump to conclusions it is important to realise that there are assumptions in this analysis. The first is that our “similar companies” are actually similar to MTX. If not, the difference in P/E might be a result of other factors. For example, if MTU Aero Engines AG is growing faster than its peers, then it would deserve a higher P/E ratio. We should also be aware that the stocks we are comparing to MTX may not be fairly valued. Thus while we might conclude that it is richly valued relative to its peers, that could be explained by the peer group being undervalued.
What this means for you:
Since you may have already conducted your due diligence on MTX, the overvaluation of the stock may mean it is a good time to reduce your current holdings. But at the end of the day, keep in mind that relative valuation relies heavily on critical assumptions I’ve outlined above. Remember that basing your investment decision off one metric alone is certainly not sufficient. There are many things I have not taken into account in this article and the PE ratio is very one-dimensional. If you have not done so already, I highly recommend you to complete your research by taking a look at the following:
Future Outlook: What are well-informed industry analysts predicting for MTX’s future growth? Take a look at our free research report of analyst consensus for MTX’s outlook.
Past Track Record: Has MTX been consistently performing well irrespective of the ups and downs in the market? Go into more detail in the past performance analysis and take a look at the free visual representations of MTX’s historicals for more clarity.
Other High-Performing Stocks: Are there other stocks that provide better prospects with proven track records? Explore our free list of these great stocks here.
To help readers see past the short term volatility of the financial market, we aim to bring you a long-term focused research analysis purely driven by fundamental data. Note that our analysis does not factor in the latest price-sensitive company announcements.
The author is an independent contributor and at the time of publication had no position in the stocks mentioned. For errors that warrant correction please contact the editor at editorial-team@simplywallst.com.
