
 Yahoo Finance
 How Much Have Close Brothers Group (LON:CBG) Shareholders Earned On Their Investment Over The Last Five Years?

Close Brothers Group plc (LON:CBG) shareholders should be happy to see the share price up 23% in the last month. But that doesn't change the fact that the returns over the last five years have been less than pleasing. After all, the share price is down 10% in that time, significantly under-performing the market.
Check out our latest analysis for Close Brothers Group
In his essay The Superinvestors of Graham-and-Doddsville Warren Buffett described how share prices do not always rationally reflect the value of a business. One flawed but reasonable way to assess how sentiment around a company has changed is to compare the earnings per share (EPS) with the share price.
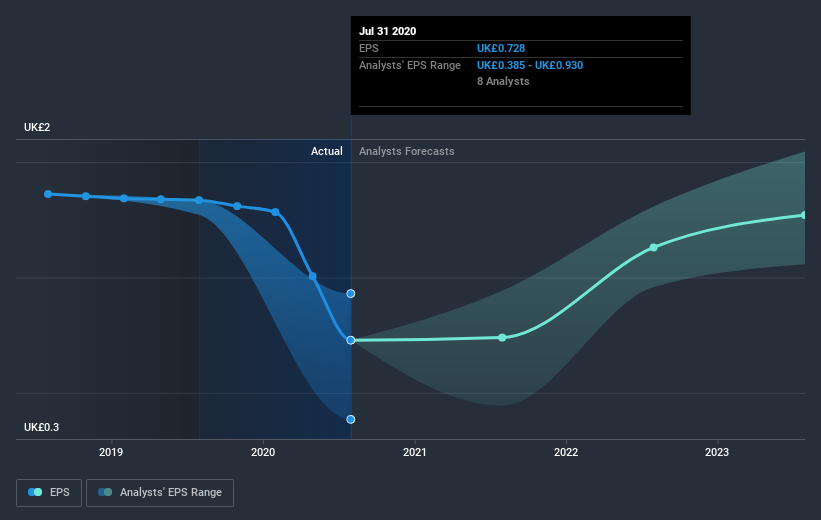
Looking back five years, both Close Brothers Group's share price and EPS declined; the latter at a rate of 9.2% per year. The share price decline of 2% per year isn't as bad as the EPS decline. So investors might expect EPS to bounce back -- or they may have previously foreseen the EPS decline.
You can see below how EPS has changed over time (discover the exact values by clicking on the image).
We like that insiders have been buying shares in the last twelve months. Even so, future earnings will be far more important to whether current shareholders make money. This free interactive report on Close Brothers Group's earnings, revenue and cash flow is a great place to start, if you want to investigate the stock further.
What About Dividends?
As well as measuring the share price return, investors should also consider the total shareholder return (TSR). Whereas the share price return only reflects the change in the share price, the TSR includes the value of dividends (assuming they were reinvested) and the benefit of any discounted capital raising or spin-off. Arguably, the TSR gives a more comprehensive picture of the return generated by a stock. As it happens, Close Brothers Group's TSR for the last 5 years was 11%, which exceeds the share price return mentioned earlier. This is largely a result of its dividend payments!
A Different Perspective
While it's never nice to take a loss, Close Brothers Group shareholders can take comfort that , including dividends,their trailing twelve month loss of 4.8% wasn't as bad as the market loss of around 6.2%. Of course, the long term returns are far more important and the good news is that over five years, the stock has returned 2% for each year. In the best case scenario the last year is just a temporary blip on the journey to a brighter future. While it is well worth considering the different impacts that market conditions can have on the share price, there are other factors that are even more important. Consider risks, for instance. Every company has them, and we've spotted 3 warning signs for Close Brothers Group you should know about.
Close Brothers Group is not the only stock that insiders are buying. For those who like to find winning investments this free list of growing companies with recent insider purchasing, could be just the ticket.
Please note, the market returns quoted in this article reflect the market weighted average returns of stocks that currently trade on GB exchanges.
This article by Simply Wall St is general in nature. It does not constitute a recommendation to buy or sell any stock, and does not take account of your objectives, or your financial situation. We aim to bring you long-term focused analysis driven by fundamental data. Note that our analysis may not factor in the latest price-sensitive company announcements or qualitative material. Simply Wall St has no position in any stocks mentioned.
Have feedback on this article? Concerned about the content? Get in touch with us directly. Alternatively, email editorial-team@simplywallst.com.
