
 Yahoo Finance
 How Much Did Aurizon Holdings'(ASX:AZJ) Shareholders Earn From Share Price Movements Over The Last Year?
Passive investing in an index fund is a good way to ensure your own returns roughly match the overall market. But if you buy individual stocks, you can do both better or worse than that. Unfortunately the Aurizon Holdings Limited (ASX:AZJ) share price slid 22% over twelve months. That falls noticeably short of the market return of around 29%. However, the longer term returns haven't been so bad, with the stock down 15% in the last three years. Unhappily, the share price slid 2.4% in the last week.
View our latest analysis for Aurizon Holdings
To quote Buffett, 'Ships will sail around the world but the Flat Earth Society will flourish. There will continue to be wide discrepancies between price and value in the marketplace...' By comparing earnings per share (EPS) and share price changes over time, we can get a feel for how investor attitudes to a company have morphed over time.
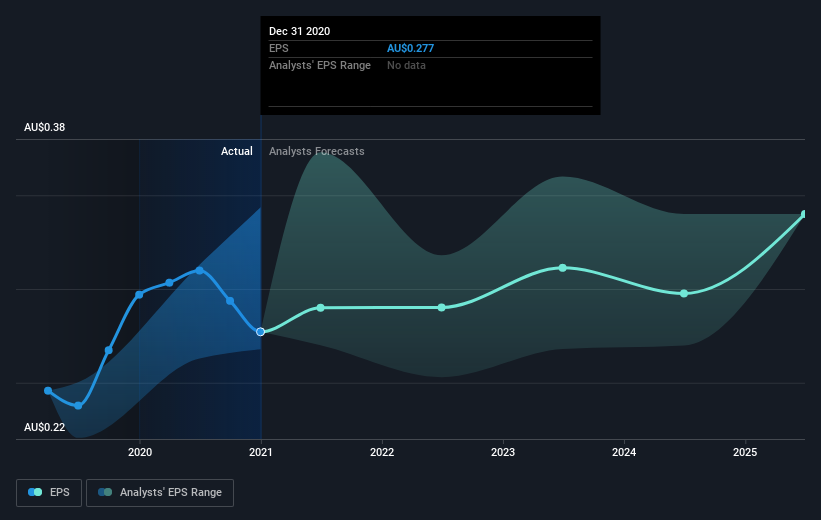
Unhappily, Aurizon Holdings had to report a 6.7% decline in EPS over the last year. The share price decline of 22% is actually more than the EPS drop. Unsurprisingly, given the lack of EPS growth, the market seems to be more cautious about the stock.
The graphic below depicts how EPS has changed over time (unveil the exact values by clicking on the image).
We like that insiders have been buying shares in the last twelve months. Even so, future earnings will be far more important to whether current shareholders make money. Dive deeper into the earnings by checking this interactive graph of Aurizon Holdings' earnings, revenue and cash flow.
What About Dividends?
As well as measuring the share price return, investors should also consider the total shareholder return (TSR). The TSR is a return calculation that accounts for the value of cash dividends (assuming that any dividend received was reinvested) and the calculated value of any discounted capital raisings and spin-offs. So for companies that pay a generous dividend, the TSR is often a lot higher than the share price return. We note that for Aurizon Holdings the TSR over the last year was -16%, which is better than the share price return mentioned above. This is largely a result of its dividend payments!
A Different Perspective
Aurizon Holdings shareholders are down 16% for the year (even including dividends), but the market itself is up 29%. Even the share prices of good stocks drop sometimes, but we want to see improvements in the fundamental metrics of a business, before getting too interested. Longer term investors wouldn't be so upset, since they would have made 0.9%, each year, over five years. It could be that the recent sell-off is an opportunity, so it may be worth checking the fundamental data for signs of a long term growth trend. It's always interesting to track share price performance over the longer term. But to understand Aurizon Holdings better, we need to consider many other factors. Consider for instance, the ever-present spectre of investment risk. We've identified 2 warning signs with Aurizon Holdings (at least 1 which makes us a bit uncomfortable) , and understanding them should be part of your investment process.
Aurizon Holdings is not the only stock insiders are buying. So take a peek at this free list of growing companies with insider buying.
Please note, the market returns quoted in this article reflect the market weighted average returns of stocks that currently trade on AU exchanges.
This article by Simply Wall St is general in nature. It does not constitute a recommendation to buy or sell any stock, and does not take account of your objectives, or your financial situation. We aim to bring you long-term focused analysis driven by fundamental data. Note that our analysis may not factor in the latest price-sensitive company announcements or qualitative material. Simply Wall St has no position in any stocks mentioned.
Have feedback on this article? Concerned about the content? Get in touch with us directly. Alternatively, email editorial-team (at) simplywallst.com.
