
 Yahoo Finance
 How Much Did ContourGlobal's(LON:GLO) Shareholders Earn From Share Price Movements Over The Last Three Years?
Many investors define successful investing as beating the market average over the long term. But in any portfolio, there are likely to be some stocks that fall short of that benchmark. We regret to report that long term ContourGlobal plc (LON:GLO) shareholders have had that experience, with the share price dropping 16% in three years, versus a market return of about 14%. There was little comfort for shareholders in the last week as the price declined a further 2.7%.
See our latest analysis for ContourGlobal
In his essay The Superinvestors of Graham-and-Doddsville Warren Buffett described how share prices do not always rationally reflect the value of a business. One imperfect but simple way to consider how the market perception of a company has shifted is to compare the change in the earnings per share (EPS) with the share price movement.
During the three years that the share price fell, ContourGlobal's earnings per share (EPS) dropped by 8.7% each year. This fall in the EPS is worse than the 6% compound annual share price fall. So, despite the prior disappointment, shareholders must have some confidence the situation will improve, longer term. With a P/E ratio of 110.61, it's fair to say the market sees a brighter future for the business.
You can see how EPS has changed over time in the image below (click on the chart to see the exact values).
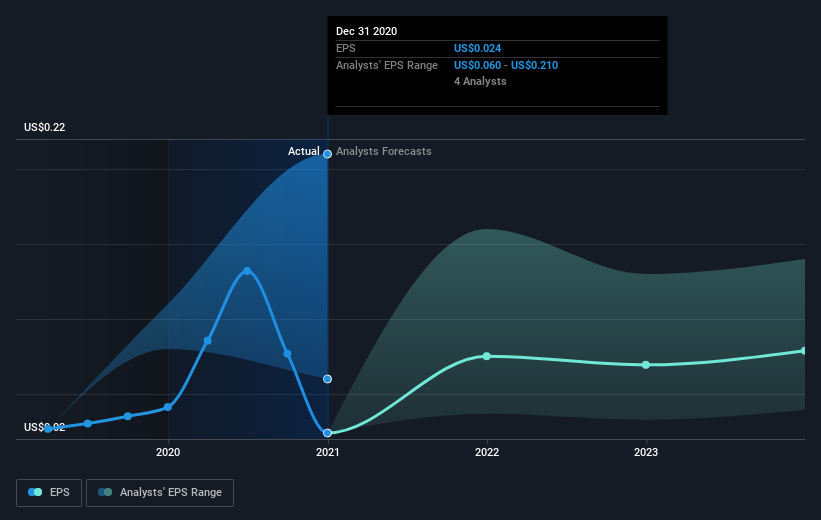
It might be well worthwhile taking a look at our free report on ContourGlobal's earnings, revenue and cash flow.
What About Dividends?
As well as measuring the share price return, investors should also consider the total shareholder return (TSR). The TSR is a return calculation that accounts for the value of cash dividends (assuming that any dividend received was reinvested) and the calculated value of any discounted capital raisings and spin-offs. It's fair to say that the TSR gives a more complete picture for stocks that pay a dividend. In the case of ContourGlobal, it has a TSR of 2.2% for the last 3 years. That exceeds its share price return that we previously mentioned. This is largely a result of its dividend payments!
A Different Perspective
ContourGlobal produced a TSR of 7.4% over the last year. While you don't go broke making a profit, this return was actually lower than the average market return of about 25%. On the bright side that gain is actually better than the average return of 0.7% over the last three years, implying that the company is doing better recently. If the share price is up as a result of improved business performance, then this kind of improvement may be sustained. While it is well worth considering the different impacts that market conditions can have on the share price, there are other factors that are even more important. For example, we've discovered 4 warning signs for ContourGlobal (2 shouldn't be ignored!) that you should be aware of before investing here.
If you like to buy stocks alongside management, then you might just love this free list of companies. (Hint: insiders have been buying them).
Please note, the market returns quoted in this article reflect the market weighted average returns of stocks that currently trade on GB exchanges.
This article by Simply Wall St is general in nature. It does not constitute a recommendation to buy or sell any stock, and does not take account of your objectives, or your financial situation. We aim to bring you long-term focused analysis driven by fundamental data. Note that our analysis may not factor in the latest price-sensitive company announcements or qualitative material. Simply Wall St has no position in any stocks mentioned.
Have feedback on this article? Concerned about the content? Get in touch with us directly. Alternatively, email editorial-team (at) simplywallst.com.
