
 Yahoo Finance
 How Much Did National Express Group PLC's (LON:NEX) CEO Pocket Last Year?

Dean Finch has been the CEO of National Express Group PLC (LON:NEX) since 2010. This analysis aims first to contrast CEO compensation with other companies that have similar market capitalization. Next, we'll consider growth that the business demonstrates. Third, we'll reflect on the total return to shareholders over three years, as a second measure of business performance. This process should give us an idea about how appropriately the CEO is paid.
View our latest analysis for National Express Group
How Does Dean Finch's Compensation Compare With Similar Sized Companies?
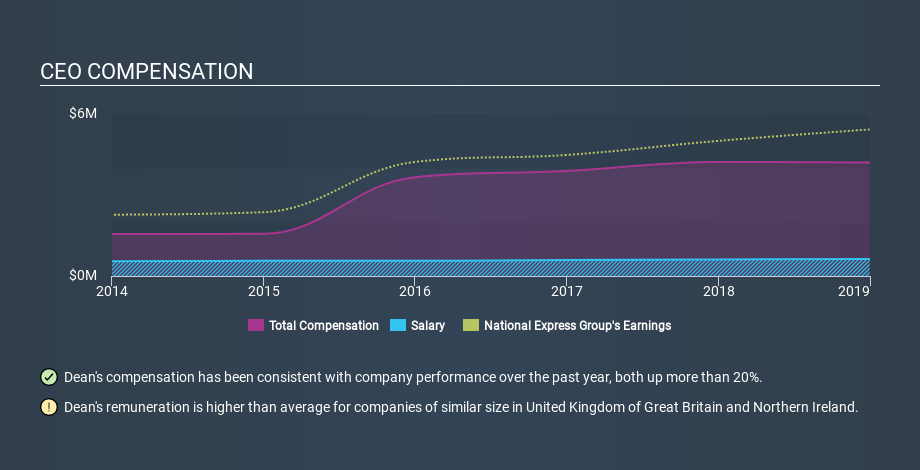
According to our data, National Express Group PLC has a market capitalization of UK£2.4b, and paid its CEO total annual compensation worth UK£4.2m over the year to December 2018. We think total compensation is more important but we note that the CEO salary is lower, at UK£630k. We note that more than half of the total compensation is not the salary; and performance requirements may apply to this non-salary portion. When we examined a selection of companies with market caps ranging from UK£1.5b to UK£4.9b, we found the median CEO total compensation was UK£1.7m.
Thus we can conclude that Dean Finch receives more in total compensation than the median of a group of companies in the same market, and of similar size to National Express Group PLC. However, this doesn't necessarily mean the pay is too high. A closer look at the performance of the underlying business will give us a better idea about whether the pay is particularly generous.
You can see a visual representation of the CEO compensation at National Express Group, below.
Is National Express Group PLC Growing?
On average over the last three years, National Express Group PLC has grown earnings per share (EPS) by 9.7% each year (using a line of best fit). It achieved revenue growth of 9.3% over the last year.
I would argue that the improvement in revenue isn't particularly impressive, but I'm happy with the modest EPS growth. It's clear the performance has been quite decent, but it it falls short of outstanding,based on this information. You might want to check this free visual report on analyst forecasts for future earnings.
Has National Express Group PLC Been A Good Investment?
I think that the total shareholder return of 50%, over three years, would leave most National Express Group PLC shareholders smiling. So they may not be at all concerned if the CEO were to be paid more than is normal for companies around the same size.
In Summary...
We compared the total CEO remuneration paid by National Express Group PLC, and compared it to remuneration at a group of similar sized companies. We found that it pays well over the median amount paid in the benchmark group.
Over the last three years returns to investors have been great, though we might have liked stronger business growth. So, considering these tasty returns, the CEO compensation may be quite appropriate. If you think CEO compensation levels are interesting you will probably really like this free visualization of insider trading at National Express Group.
If you want to buy a stock that is better than National Express Group, this free list of high return, low debt companies is a great place to look.
If you spot an error that warrants correction, please contact the editor at editorial-team@simplywallst.com. This article by Simply Wall St is general in nature. It does not constitute a recommendation to buy or sell any stock, and does not take account of your objectives, or your financial situation. Simply Wall St has no position in the stocks mentioned.
We aim to bring you long-term focused research analysis driven by fundamental data. Note that our analysis may not factor in the latest price-sensitive company announcements or qualitative material. Thank you for reading.
