
 Yahoo Finance
 How Much Did OPG Power Ventures'(LON:OPG) Shareholders Earn From Share Price Movements Over The Last Five Years?
We think intelligent long term investing is the way to go. But unfortunately, some companies simply don't succeed. To wit, the OPG Power Ventures Plc (LON:OPG) share price managed to fall 71% over five long years. We certainly feel for shareholders who bought near the top. Even worse, it's down 8.6% in about a month, which isn't fun at all.
See our latest analysis for OPG Power Ventures
There is no denying that markets are sometimes efficient, but prices do not always reflect underlying business performance. By comparing earnings per share (EPS) and share price changes over time, we can get a feel for how investor attitudes to a company have morphed over time.
Looking back five years, both OPG Power Ventures' share price and EPS declined; the latter at a rate of 7.3% per year. Readers should note that the share price has fallen faster than the EPS, at a rate of 22% per year, over the period. So it seems the market was too confident about the business, in the past. The low P/E ratio of 5.00 further reflects this reticence.
The graphic below depicts how EPS has changed over time (unveil the exact values by clicking on the image).
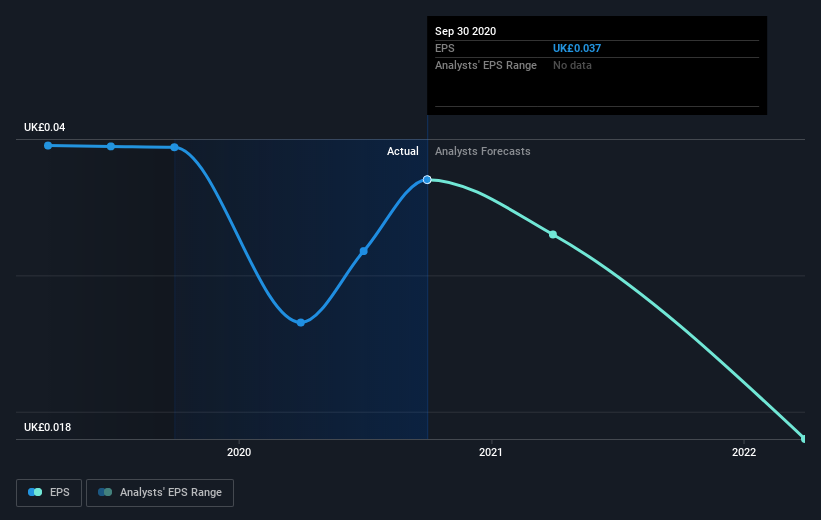
This free interactive report on OPG Power Ventures' earnings, revenue and cash flow is a great place to start, if you want to investigate the stock further.
A Different Perspective
It's nice to see that OPG Power Ventures shareholders have received a total shareholder return of 68% over the last year. Notably the five-year annualised TSR loss of 11% per year compares very unfavourably with the recent share price performance. We generally put more weight on the long term performance over the short term, but the recent improvement could hint at a (positive) inflection point within the business. It's always interesting to track share price performance over the longer term. But to understand OPG Power Ventures better, we need to consider many other factors. For example, we've discovered 1 warning sign for OPG Power Ventures that you should be aware of before investing here.
If you would prefer to check out another company -- one with potentially superior financials -- then do not miss this free list of companies that have proven they can grow earnings.
Please note, the market returns quoted in this article reflect the market weighted average returns of stocks that currently trade on GB exchanges.
This article by Simply Wall St is general in nature. It does not constitute a recommendation to buy or sell any stock, and does not take account of your objectives, or your financial situation. We aim to bring you long-term focused analysis driven by fundamental data. Note that our analysis may not factor in the latest price-sensitive company announcements or qualitative material. Simply Wall St has no position in any stocks mentioned.
Have feedback on this article? Concerned about the content? Get in touch with us directly. Alternatively, email editorial-team (at) simplywallst.com.
