
 Yahoo Finance
 How Much Did Springfield Properties'(LON:SPR) Shareholders Earn From Share Price Movements Over The Last Year?

It's easy to match the overall market return by buying an index fund. Active investors aim to buy stocks that vastly outperform the market - but in the process, they risk under-performance. For example, the Springfield Properties Plc (LON:SPR) share price is down 17% in the last year. That's well below the market decline of 14%. At least the damage isn't so bad if you look at the last three years, since the stock is down 14% in that time.
View our latest analysis for Springfield Properties
To quote Buffett, 'Ships will sail around the world but the Flat Earth Society will flourish. There will continue to be wide discrepancies between price and value in the marketplace...' One imperfect but simple way to consider how the market perception of a company has shifted is to compare the change in the earnings per share (EPS) with the share price movement.
Unfortunately Springfield Properties reported an EPS drop of 41% for the last year. The share price fall of 17% isn't as bad as the reduction in earnings per share. It may have been that the weak EPS was not as bad as some had feared.
The image below shows how EPS has tracked over time (if you click on the image you can see greater detail).
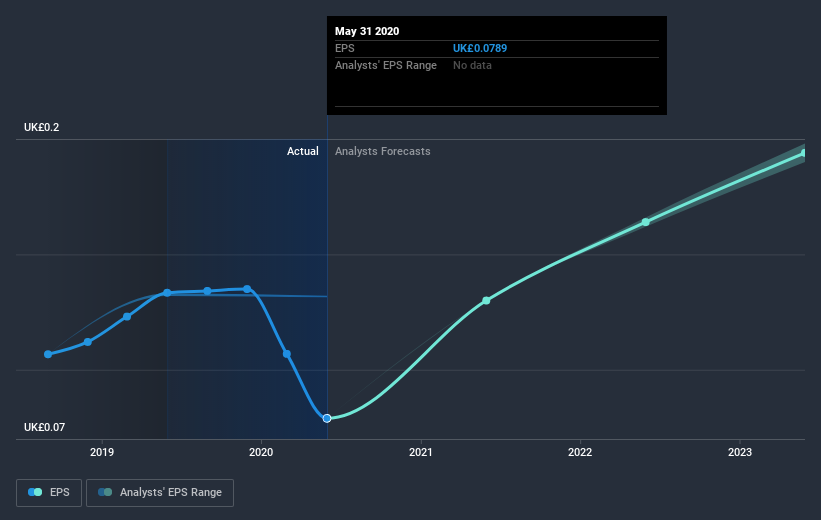
Dive deeper into Springfield Properties' key metrics by checking this interactive graph of Springfield Properties's earnings, revenue and cash flow.
A Different Perspective
The last twelve months weren't great for Springfield Properties shares, which performed worse than the market, costing holders 17%, including dividends. The market shed around 14%, no doubt weighing on the stock price. The three-year loss of 2.5% per year isn't as bad as the last twelve months, suggesting that the company has not been able to convince the market it has solved its problems. Although Baron Rothschild famously said to "buy when there's blood in the streets, even if the blood is your own", he also focusses on high quality stocks with solid prospects. While it is well worth considering the different impacts that market conditions can have on the share price, there are other factors that are even more important. Consider for instance, the ever-present spectre of investment risk. We've identified 3 warning signs with Springfield Properties (at least 2 which are significant) , and understanding them should be part of your investment process.
If you would prefer to check out another company -- one with potentially superior financials -- then do not miss this free list of companies that have proven they can grow earnings.
Please note, the market returns quoted in this article reflect the market weighted average returns of stocks that currently trade on GB exchanges.
This article by Simply Wall St is general in nature. It does not constitute a recommendation to buy or sell any stock, and does not take account of your objectives, or your financial situation. We aim to bring you long-term focused analysis driven by fundamental data. Note that our analysis may not factor in the latest price-sensitive company announcements or qualitative material. Simply Wall St has no position in any stocks mentioned.
Have feedback on this article? Concerned about the content? Get in touch with us directly. Alternatively, email editorial-team@simplywallst.com.
