
 Yahoo Finance
 How Much Did Stobart Group's(LON:STOB) Shareholders Earn From Share Price Movements Over The Last Three Years?

Stobart Group Limited (LON:STOB) has rebounded strongly over the last week, with the share price soaring 46%. But that doesn't change the fact that the returns over the last three years have been stomach churning. In that time the share price has melted like a snowball in the desert, down 90%. So it's about time shareholders saw some gains. Of course the real question is whether the business can sustain a turnaround.
While a drop like that is definitely a body blow, money isn't as important as health and happiness.
Check out our latest analysis for Stobart Group
Stobart Group wasn't profitable in the last twelve months, it is unlikely we'll see a strong correlation between its share price and its earnings per share (EPS). Arguably revenue is our next best option. Shareholders of unprofitable companies usually expect strong revenue growth. As you can imagine, fast revenue growth, when maintained, often leads to fast profit growth.
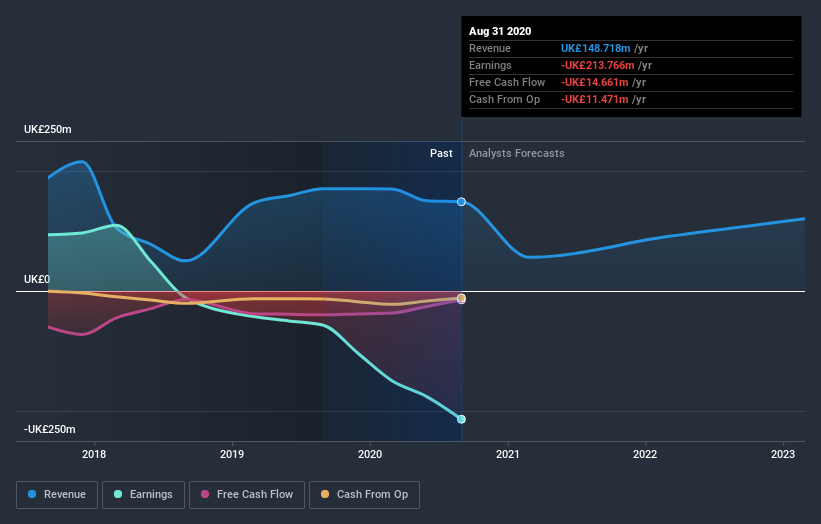
In the last three years, Stobart Group saw its revenue grow by 3.4% per year, compound. Given it's losing money in pursuit of growth, we are not really impressed with that. Nonetheless, it's fair to say the rapidly declining share price (down 24%, compound, over three years) suggests the market is very disappointed with this level of growth. While we're definitely wary of the stock, after that kind of performance, it could be an over-reaction. Of course, revenue growth is nice but generally speaking the lower the profits, the riskier the business - and this business isn't making steady profits.
The company's revenue and earnings (over time) are depicted in the image below (click to see the exact numbers).
We consider it positive that insiders have made significant purchases in the last year. Even so, future earnings will be far more important to whether current shareholders make money. So we recommend checking out this free report showing consensus forecasts
A Different Perspective
While the broader market lost about 7.0% in the twelve months, Stobart Group shareholders did even worse, losing 79%. However, it could simply be that the share price has been impacted by broader market jitters. It might be worth keeping an eye on the fundamentals, in case there's a good opportunity. Unfortunately, last year's performance may indicate unresolved challenges, given that it was worse than the annualised loss of 11% over the last half decade. Generally speaking long term share price weakness can be a bad sign, though contrarian investors might want to research the stock in hope of a turnaround. While it is well worth considering the different impacts that market conditions can have on the share price, there are other factors that are even more important. Consider for instance, the ever-present spectre of investment risk. We've identified 4 warning signs with Stobart Group (at least 3 which can't be ignored) , and understanding them should be part of your investment process.
If you like to buy stocks alongside management, then you might just love this free list of companies. (Hint: insiders have been buying them).
Please note, the market returns quoted in this article reflect the market weighted average returns of stocks that currently trade on GB exchanges.
This article by Simply Wall St is general in nature. It does not constitute a recommendation to buy or sell any stock, and does not take account of your objectives, or your financial situation. We aim to bring you long-term focused analysis driven by fundamental data. Note that our analysis may not factor in the latest price-sensitive company announcements or qualitative material. Simply Wall St has no position in any stocks mentioned.
Have feedback on this article? Concerned about the content? Get in touch with us directly. Alternatively, email editorial-team@simplywallst.com.
