
 Yahoo Finance
 How Much is John Lewis of Hungerford plc's (LON:JLH) CEO Getting Paid?

Kiran Noonan is the CEO of John Lewis of Hungerford plc (LON:JLH). This analysis aims first to contrast CEO compensation with other companies that have similar market capitalization. After that, we will consider the growth in the business. Third, we'll reflect on the total return to shareholders over three years, as a second measure of business performance. This method should give us information to assess how appropriately the company pays the CEO.
See our latest analysis for John Lewis of Hungerford
How Does Kiran Noonan's Compensation Compare With Similar Sized Companies?
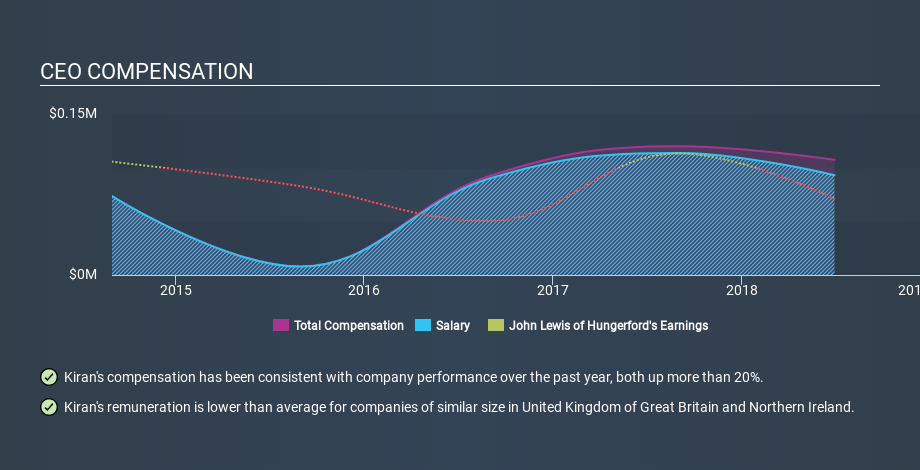
Our data indicates that John Lewis of Hungerford plc is worth UK£980k, and total annual CEO compensation was reported as UK£107k for the year to June 2018. While this analysis focuses on total compensation, it's worth noting the salary is lower, valued at UK£93k. We took a group of companies with market capitalizations below UK£153m, and calculated the median CEO total compensation to be UK£251k.
Most shareholders would consider it a positive that Kiran Noonan takes less total compensation than the CEOs of most similar size companies, leaving more for shareholders. However, before we heap on the praise, we should delve deeper to understand business performance.
You can see, below, how CEO compensation at John Lewis of Hungerford has changed over time.
Is John Lewis of Hungerford plc Growing?
Over the last three years John Lewis of Hungerford plc has shrunk its earnings per share by an average of 24% per year (measured with a line of best fit). In the last year, its revenue is up 3.1%.
Sadly for shareholders, earnings per share are actually down, over three years. And the modest revenue growth over 12 months isn't much comfort against the reduced earnings per share. These factors suggest that the business performance wouldn't really justify a high pay packet for the CEO. Although we don't have analyst forecasts shareholders might want to examine this detailed historical graph of earnings, revenue and cash flow.
Has John Lewis of Hungerford plc Been A Good Investment?
With a three year total loss of 52%, John Lewis of Hungerford plc would certainly have some dissatisfied shareholders. So shareholders would probably think the company shouldn't be too generous with CEO compensation.
In Summary...
It looks like John Lewis of Hungerford plc pays its CEO less than similar sized companies.
The compensation paid to Kiran Noonan is lower than is usual at similar sized companies, but the eps growth is lacking, just like the returns (over three years). We would not call the pay too generous, but nor would we claim the CEO is underpaid, given lacklustre business performance. CEO compensation is one thing, but it is also interesting to check if the CEO is buying or selling John Lewis of Hungerford (free visualization of insider trades).
Of course, you might find a fantastic investment by looking elsewhere. So take a peek at this free list of interesting companies.
If you spot an error that warrants correction, please contact the editor at editorial-team@simplywallst.com. This article by Simply Wall St is general in nature. It does not constitute a recommendation to buy or sell any stock, and does not take account of your objectives, or your financial situation. Simply Wall St has no position in the stocks mentioned.
We aim to bring you long-term focused research analysis driven by fundamental data. Note that our analysis may not factor in the latest price-sensitive company announcements or qualitative material. Thank you for reading.
