
 Yahoo Finance
 How Much is Rollins' (NYSE:ROL) CEO Getting Paid?

Gary Rollins became the CEO of Rollins, Inc. (NYSE:ROL) in 2001, and we think it's a good time to look at the executive's compensation against the backdrop of overall company performance. This analysis will also assess whether Rollins pays its CEO appropriately, considering recent earnings growth and total shareholder returns.
See our latest analysis for Rollins
How Does Total Compensation For Gary Rollins Compare With Other Companies In The Industry?
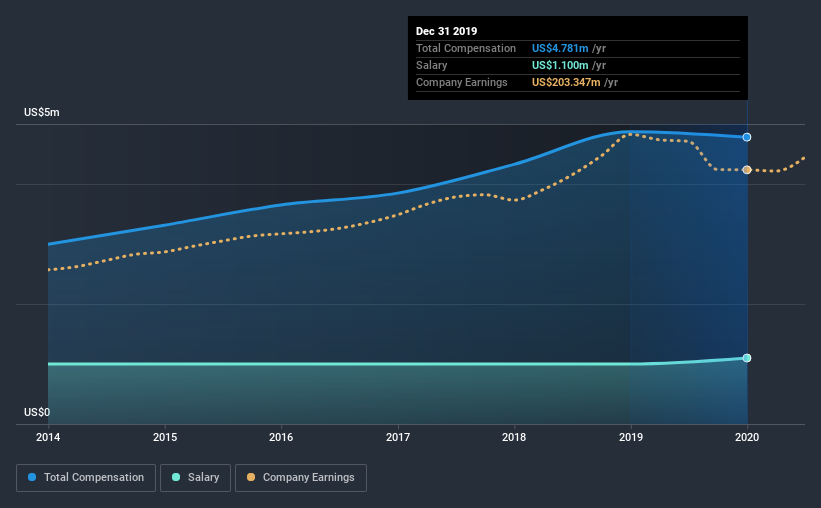
Our data indicates that Rollins, Inc. has a market capitalization of US$18b, and total annual CEO compensation was reported as US$4.8m for the year to December 2019. That is, the compensation was roughly the same as last year. While we always look at total compensation first, our analysis shows that the salary component is less, at US$1.1m.
On comparing similar companies in the industry with market capitalizations above US$8.0b, we found that the median total CEO compensation was US$8.6m. Accordingly, Rollins pays its CEO under the industry median. Moreover, Gary Rollins also holds US$207m worth of Rollins stock directly under their own name, which reveals to us that they have a significant personal stake in the company.
Component | 2019 | 2018 | Proportion (2019) |
Salary | US$1.1m | US$1.0m | 23% |
Other | US$3.7m | US$3.9m | 77% |
Total Compensation | US$4.8m | US$4.9m | 100% |
Speaking on an industry level, nearly 23% of total compensation represents salary, while the remainder of 77% is other remuneration. There isn't a significant difference between Rollins and the broader market, in terms of salary allocation in the overall compensation package. If total compensation is slanted towards non-salary benefits, it indicates that CEO pay is linked to company performance.
Rollins, Inc.'s Growth
Rollins, Inc.'s earnings per share (EPS) grew 5.5% per year over the last three years. In the last year, its revenue is up 12%.
This revenue growth could really point to a brighter future. And the modest growth in EPS isn't bad, either. Although we'll stop short of calling the stock a top performer, we think the company has potential. Moving away from current form for a second, it could be important to check this free visual depiction of what analysts expect for the future.
Has Rollins, Inc. Been A Good Investment?
Boasting a total shareholder return of 91% over three years, Rollins, Inc. has done well by shareholders. As a result, some may believe the CEO should be paid more than is normal for companies of similar size.
In Summary...
As we noted earlier, Rollins pays its CEO lower than the norm for similar-sized companies belonging to the same industry. In contrast, shareholder returns have been excellent over the past three years, and that’s certainly a promising trend to keep an eye on. As a result of the juicy return to investors, CEO compensation may well be quite reasonable.
If you think CEO compensation levels are interesting you will probably really like this free visualization of insider trading at Rollins.
Of course, you might find a fantastic investment by looking at a different set of stocks. So take a peek at this free list of interesting companies.
This article by Simply Wall St is general in nature. It does not constitute a recommendation to buy or sell any stock, and does not take account of your objectives, or your financial situation. We aim to bring you long-term focused analysis driven by fundamental data. Note that our analysis may not factor in the latest price-sensitive company announcements or qualitative material. Simply Wall St has no position in any stocks mentioned.
Have feedback on this article? Concerned about the content? Get in touch with us directly. Alternatively, email editorial-team@simplywallst.com.