
 Yahoo Finance
 Mulberry Group's (LON:MUL) Shareholders Are Down 86% On Their Shares

Every investor on earth makes bad calls sometimes. But you want to avoid the really big losses like the plague. So take a moment to sympathize with the long term shareholders of Mulberry Group plc (LON:MUL), who have seen the share price tank a massive 86% over a three year period. That might cause some serious doubts about the merits of the initial decision to buy the stock, to put it mildly. And the ride hasn't got any smoother in recent times over the last year, with the price 47% lower in that time. Shareholders have had an even rougher run lately, with the share price down 24% in the last 90 days. We note that the company has reported results fairly recently; and the market is hardly delighted. You can check out the latest numbers in our company report.
We really hope anyone holding through that price crash has a diversified portfolio. Even when you lose money, you don't have to lose the lesson.
See our latest analysis for Mulberry Group
Because Mulberry Group made a loss in the last twelve months, we think the market is probably more focussed on revenue and revenue growth, at least for now. When a company doesn't make profits, we'd generally expect to see good revenue growth. That's because it's hard to be confident a company will be sustainable if revenue growth is negligible, and it never makes a profit.
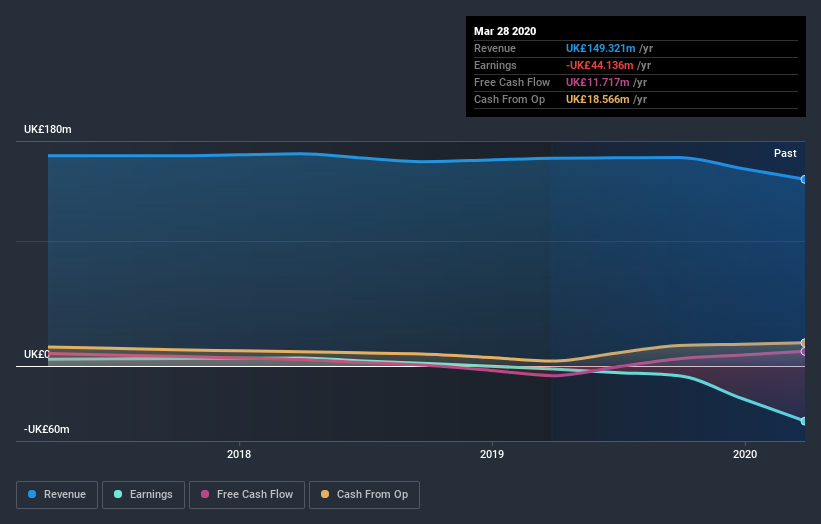
In the last three years Mulberry Group saw its revenue shrink by 2.5% per year. That's not what investors generally want to see. The share price fall of 23% (per year, over three years) is a stern reminder that money-losing companies are expected to grow revenue. We're generally averse to companies with declining revenues, but we're not alone in that. There's no more than a snowball's chance in hell that share price will head back to its old highs, in the short term.
The company's revenue and earnings (over time) are depicted in the image below (click to see the exact numbers).
You can see how its balance sheet has strengthened (or weakened) over time in this free interactive graphic.
A Different Perspective
While the broader market lost about 13% in the twelve months, Mulberry Group shareholders did even worse, losing 47%. However, it could simply be that the share price has been impacted by broader market jitters. It might be worth keeping an eye on the fundamentals, in case there's a good opportunity. Unfortunately, last year's performance may indicate unresolved challenges, given that it was worse than the annualised loss of 13% over the last half decade. Generally speaking long term share price weakness can be a bad sign, though contrarian investors might want to research the stock in hope of a turnaround. It's always interesting to track share price performance over the longer term. But to understand Mulberry Group better, we need to consider many other factors. Even so, be aware that Mulberry Group is showing 2 warning signs in our investment analysis , and 1 of those is a bit concerning...
If you are like me, then you will not want to miss this free list of growing companies that insiders are buying.
Please note, the market returns quoted in this article reflect the market weighted average returns of stocks that currently trade on GB exchanges.
This article by Simply Wall St is general in nature. It does not constitute a recommendation to buy or sell any stock, and does not take account of your objectives, or your financial situation. We aim to bring you long-term focused analysis driven by fundamental data. Note that our analysis may not factor in the latest price-sensitive company announcements or qualitative material. Simply Wall St has no position in any stocks mentioned.
Have feedback on this article? Concerned about the content? Get in touch with us directly. Alternatively, email editorial-team@simplywallst.com.
