
 Yahoo Finance
 Mullen Group's (TSE:MTL) Returns Have Hit A Wall
Did you know there are some financial metrics that can provide clues of a potential multi-bagger? Ideally, a business will show two trends; firstly a growing return on capital employed (ROCE) and secondly, an increasing amount of capital employed. Basically this means that a company has profitable initiatives that it can continue to reinvest in, which is a trait of a compounding machine. However, after investigating Mullen Group (TSE:MTL), we don't think it's current trends fit the mold of a multi-bagger.
What is Return On Capital Employed (ROCE)?
For those who don't know, ROCE is a measure of a company's yearly pre-tax profit (its return), relative to the capital employed in the business. Analysts use this formula to calculate it for Mullen Group:
Return on Capital Employed = Earnings Before Interest and Tax (EBIT) ÷ (Total Assets - Current Liabilities)
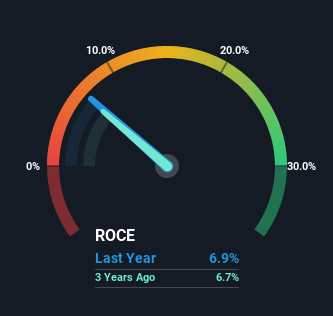
0.069 = CA$115m ÷ (CA$2.0b - CA$296m) (Based on the trailing twelve months to March 2022).
Thus, Mullen Group has an ROCE of 6.9%. Ultimately, that's a low return and it under-performs the Transportation industry average of 10%.
See our latest analysis for Mullen Group
Above you can see how the current ROCE for Mullen Group compares to its prior returns on capital, but there's only so much you can tell from the past. If you're interested, you can view the analysts predictions in our free report on analyst forecasts for the company.
What Does the ROCE Trend For Mullen Group Tell Us?
Over the past five years, Mullen Group's ROCE and capital employed have both remained mostly flat. This tells us the company isn't reinvesting in itself, so it's plausible that it's past the growth phase. With that in mind, unless investment picks up again in the future, we wouldn't expect Mullen Group to be a multi-bagger going forward. On top of that you'll notice that Mullen Group has been paying out a large portion (63%) of earnings in the form of dividends to shareholders. Most shareholders probably know this and own the stock for its dividend.
What We Can Learn From Mullen Group's ROCE
We can conclude that in regards to Mullen Group's returns on capital employed and the trends, there isn't much change to report on. And with the stock having returned a mere 0.5% in the last five years to shareholders, you could argue that they're aware of these lackluster trends. So if you're looking for a multi-bagger, the underlying trends indicate you may have better chances elsewhere.
If you'd like to know about the risks facing Mullen Group, we've discovered 3 warning signs that you should be aware of.
For those who like to invest in solid companies, check out this free list of companies with solid balance sheets and high returns on equity.
Have feedback on this article? Concerned about the content? Get in touch with us directly. Alternatively, email editorial-team (at) simplywallst.com.
This article by Simply Wall St is general in nature. We provide commentary based on historical data and analyst forecasts only using an unbiased methodology and our articles are not intended to be financial advice. It does not constitute a recommendation to buy or sell any stock, and does not take account of your objectives, or your financial situation. We aim to bring you long-term focused analysis driven by fundamental data. Note that our analysis may not factor in the latest price-sensitive company announcements or qualitative material. Simply Wall St has no position in any stocks mentioned.