
 Yahoo Finance
 What You Must Know About Audioboom Group plc's (LON:BOOM) Financial Health

Want to participate in a short research study? Help shape the future of investing tools and you could win a $250 gift card!
Small-cap and large-cap companies receive a lot of attention from investors, but mid-cap stocks like Audioboom Group plc (LON:BOOM), with a market cap of UK£2.8b, are often out of the spotlight. However, history shows that overlooked mid-cap companies have performed better on a risk-adjusted manner than the smaller and larger segment of the market. Let’s take a look at BOOM’s debt concentration and assess their financial liquidity to get an idea of their ability to fund strategic acquisitions and grow through cyclical pressures. Remember this is a very top-level look that focuses exclusively on financial health, so I recommend a deeper analysis into BOOM here.
See our latest analysis for Audioboom Group
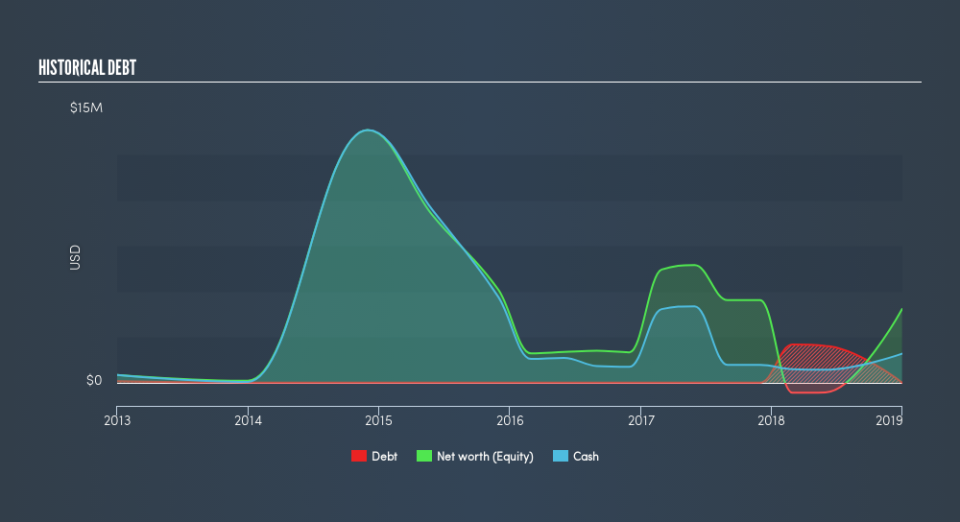
Does BOOM face the risk of succumbing to its debt-load?
Debt-to-equity ratio standards differ between industries, as some are more capital-intensive than others, meaning they need more capital to carry out core operations. As a rule of thumb, a financially healthy mid-cap should have a ratio less than 40%. For BOOM, the debt-to-equity ratio is zero, meaning that the company has no debt. This means it has been running its business utilising funding from only its equity capital, which is rather impressive. Investors' risk associated with debt is virtually non-existent with BOOM, and the company has plenty of headroom and ability to raise debt should it need to in the future.
Can BOOM meet its short-term obligations with the cash in hand?
Since Audioboom Group doesn’t have any debt on its balance sheet, it doesn’t have any solvency issues, which is a term used to describe the company’s ability to meet its long-term obligations. But another important aspect of financial health is liquidity: the company’s ability to meet short-term obligations, including payments to suppliers and employees. Looking at BOOM’s US$4.3m in current liabilities, it appears that the company has been able to meet these commitments with a current assets level of US$5.8m, leading to a 1.34x current account ratio. The current ratio is calculated by dividing current assets by current liabilities. Usually, for Interactive Media and Services companies, this is a suitable ratio since there is a bit of a cash buffer without leaving too much capital in a low-return environment.
Next Steps:
BOOM has no debt in addition to ample cash to cover its near-term liabilities. Its safe operations reduces risk for the company and its investors, but some degree of debt could also boost earnings growth and operational efficiency. I admit this is a fairly basic analysis for BOOM's financial health. Other important fundamentals need to be considered alongside. I suggest you continue to research Audioboom Group to get a better picture of the stock by looking at:
Historical Performance: What has BOOM's returns been like over the past? Go into more detail in the past track record analysis and take a look at the free visual representations of our analysis for more clarity.
Other High-Performing Stocks: Are there other stocks that provide better prospects with proven track records? Explore our free list of these great stocks here.
We aim to bring you long-term focused research analysis driven by fundamental data. Note that our analysis may not factor in the latest price-sensitive company announcements or qualitative material.
If you spot an error that warrants correction, please contact the editor at editorial-team@simplywallst.com. This article by Simply Wall St is general in nature. It does not constitute a recommendation to buy or sell any stock, and does not take account of your objectives, or your financial situation. Simply Wall St has no position in the stocks mentioned. Thank you for reading.
