
 Yahoo Finance
 What You Must Know About Balfour Beatty plc’s (LON:BBY) Financial Strength

Mid-caps stocks, like Balfour Beatty plc (LON:BBY) with a market capitalization of UK£2.02b, aren’t the focus of most investors who prefer to direct their investments towards either large-cap or small-cap stocks. Despite this, commonly overlooked mid-caps have historically produced better risk-adjusted returns than their small and large-cap counterparts. This article will examine BBY’s financial liquidity and debt levels to get an idea of whether the company can deal with cyclical downturns and maintain funds to accommodate strategic spending for future growth. Don’t forget that this is a general and concentrated examination of Balfour Beatty’s financial health, so you should conduct further analysis into BBY here. See our latest analysis for Balfour Beatty
How does BBY’s operating cash flow stack up against its debt?
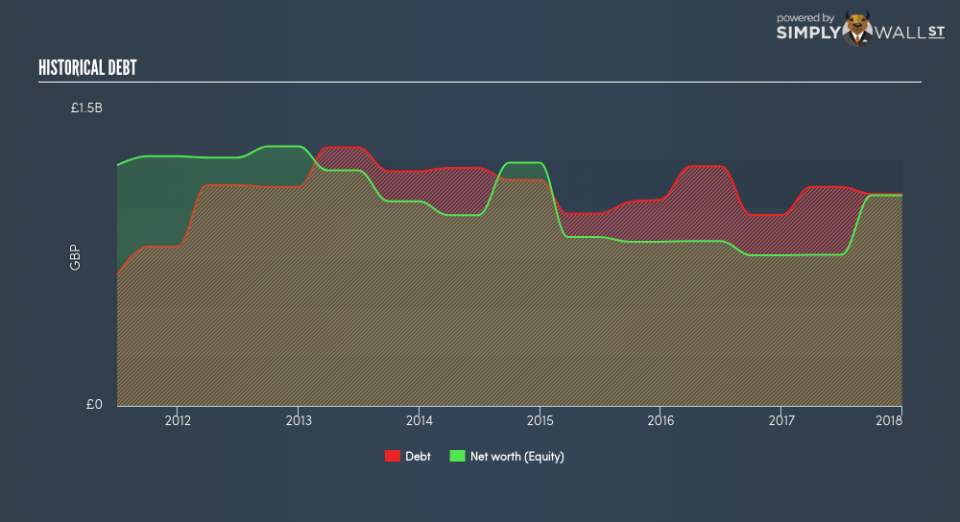
BBY has built up its total debt levels in the last twelve months, from UK£966.00m to UK£0 , which comprises of short- and long-term debt. With this increase in debt, BBY’s cash and short-term investments stands at UK£970.00m for investing into the business. Moreover, BBY has produced UK£38.00m in operating cash flow during the same period of time, resulting in an operating cash to total debt ratio of 3.54%, indicating that BBY’s current level of operating cash is not high enough to cover debt. This ratio can also be a sign of operational efficiency as an alternative to return on assets. In BBY’s case, it is able to generate 0.035x cash from its debt capital.
Can BBY meet its short-term obligations with the cash in hand?
With current liabilities at UK£2.57b, it seems that the business is not able to meet these obligations given the level of current assets of UK£2.36b, with a current ratio of 0.92x below the prudent level of 3x.
Can BBY service its debt comfortably?
BBY is a highly-leveraged company with debt exceeding equity by over 100%. This is not unusual for mid-caps as debt tends to be a cheaper and faster source of funding for some businesses. No matter how high the company’s debt, if it can easily cover the interest payments, it’s considered to be efficient with its use of excess leverage. A company generating earnings after interest and tax at least three times its net interest payments is considered financially sound. In BBY’s case, the ratio of 1.44x suggests that interest is not strongly covered, which means that lenders may refuse to lend the company more money, as it is seen as too risky in terms of default.
Next Steps:
BBY’s high debt levels is not met with high cash flow coverage. This leaves room for improvement in terms of debt management and operational efficiency. In addition to this, its low liquidity raises concerns over whether current asset management practices are properly implemented for the mid-cap. Keep in mind I haven’t considered other factors such as how BBY has been performing in the past. You should continue to research Balfour Beatty to get a more holistic view of the stock by looking at:
Future Outlook: What are well-informed industry analysts predicting for BBY’s future growth? Take a look at our free research report of analyst consensus for BBY’s outlook.
Valuation: What is BBY worth today? Is the stock undervalued, even when its growth outlook is factored into its intrinsic value? The intrinsic value infographic in our free research report helps visualize whether BBY is currently mispriced by the market.
Other High-Performing Stocks: Are there other stocks that provide better prospects with proven track records? Explore our free list of these great stocks here.
To help readers see pass the short term volatility of the financial market, we aim to bring you a long-term focused research analysis purely driven by fundamental data. Note that our analysis does not factor in the latest price sensitive company announcements.
The author is an independent contributor and at the time of publication had no position in the stocks mentioned.
