
 Yahoo Finance
 What You Must Know About Berner Kantonalbank AG’s (VTX:BEKN) 5.51% ROE

Berner Kantonalbank AG (SWX:BEKN) delivered a less impressive 5.51% ROE over the past year, compared to the 6.98% return generated by its industry. An investor may attribute an inferior ROE to a relatively inefficient performance, and whilst this can often be the case, knowing the nuts and bolts of the ROE calculation may change that perspective and give you a deeper insight into BEKN’s past performance. Metrics such as financial leverage can impact the level of ROE which in turn can affect the sustainability of BEKN’s returns. Let me show you what I mean by this. Check out our latest analysis for Berner Kantonalbank
Peeling the layers of ROE – trisecting a company’s profitability
Return on Equity (ROE) weighs Berner Kantonalbank’s profit against the level of its shareholders’ equity. It essentially shows how much the company can generate in earnings given the amount of equity it has raised. In most cases, a higher ROE is preferred; however, there are many other factors we must consider prior to making any investment decisions.
Return on Equity = Net Profit ÷ Shareholders Equity
Returns are usually compared to costs to measure the efficiency of capital. Berner Kantonalbank’s cost of equity is 10.78%. This means Berner Kantonalbank’s returns actually do not cover its own cost of equity, with a discrepancy of -5.27%. This isn’t sustainable as it implies, very simply, that the company pays more for its capital than what it generates in return. ROE can be split up into three useful ratios: net profit margin, asset turnover, and financial leverage. This is called the Dupont Formula:
Dupont Formula
ROE = profit margin × asset turnover × financial leverage
ROE = (annual net profit ÷ sales) × (sales ÷ assets) × (assets ÷ shareholders’ equity)
ROE = annual net profit ÷ shareholders’ equity

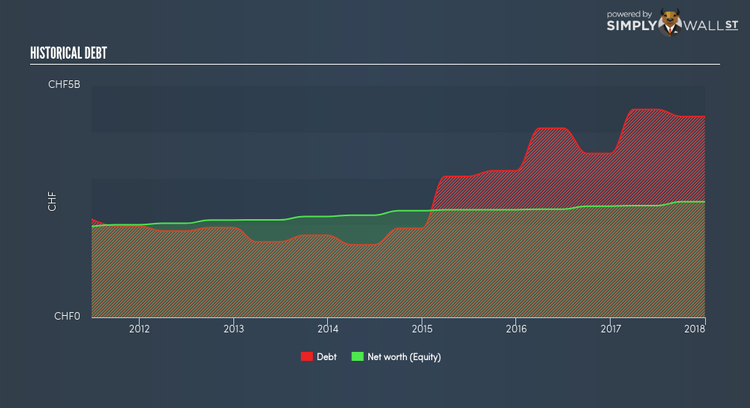
Basically, profit margin measures how much of revenue trickles down into earnings which illustrates how efficient the business is with its cost management. The other component, asset turnover, illustrates how much revenue Berner Kantonalbank can make from its asset base. And finally, financial leverage is simply how much of assets are funded by equity, which exhibits how sustainable the company’s capital structure is. Since financial leverage can artificially inflate ROE, we need to look at how much debt Berner Kantonalbank currently has. At 173.74%, Berner Kantonalbank’s debt-to-equity ratio appears relatively high and indicates the below-average ROE is already being generated by significant leverage levels.
Next Steps:
ROE is one of many ratios which meaningfully dissects financial statements, which illustrates the quality of a company. Berner Kantonalbank’s below-industry ROE is disappointing, furthermore, its returns were not even high enough to cover its own cost of equity. However, ROE is not likely to be inflated by excessive debt funding, giving shareholders more conviction in the sustainability of returns, which has headroom to increase further. Although ROE can be a useful metric, it is only a small part of diligent research.
For Berner Kantonalbank, I’ve put together three essential factors you should further examine:
Financial Health: Does it have a healthy balance sheet? Take a look at our free balance sheet analysis with six simple checks on key factors like leverage and risk.
Valuation: What is Berner Kantonalbank worth today? Is the stock undervalued, even when its growth outlook is factored into its intrinsic value? The intrinsic value infographic in our free research report helps visualize whether Berner Kantonalbank is currently mispriced by the market.
Other High-Growth Alternatives : Are there other high-growth stocks you could be holding instead of Berner Kantonalbank? Explore our interactive list of stocks with large growth potential to get an idea of what else is out there you may be missing!
To help readers see pass the short term volatility of the financial market, we aim to bring you a long-term focused research analysis purely driven by fundamental data. Note that our analysis does not factor in the latest price sensitive company announcements.
The author is an independent contributor and at the time of publication had no position in the stocks mentioned.
