
 Yahoo Finance
 What You Must Know About Black Knight, Inc.'s (NYSE:BKI) Financial Strength

Small-cap and large-cap companies receive a lot of attention from investors, but mid-cap stocks like Black Knight, Inc. (NYSE:BKI), with a market cap of US$8.4b, are often out of the spotlight. However, history shows that overlooked mid-cap companies have performed better on a risk-adjusted manner than the smaller and larger segment of the market. This article will examine BKI’s financial liquidity and debt levels to get an idea of whether the company can deal with cyclical downturns and maintain funds to accommodate strategic spending for future growth. Don’t forget that this is a general and concentrated examination of Black Knight’s financial health, so you should conduct further analysis into BKI here.
Want to participate in a short research study? Help shape the future of investing tools and you could win a $250 gift card!
Check out our latest analysis for Black Knight
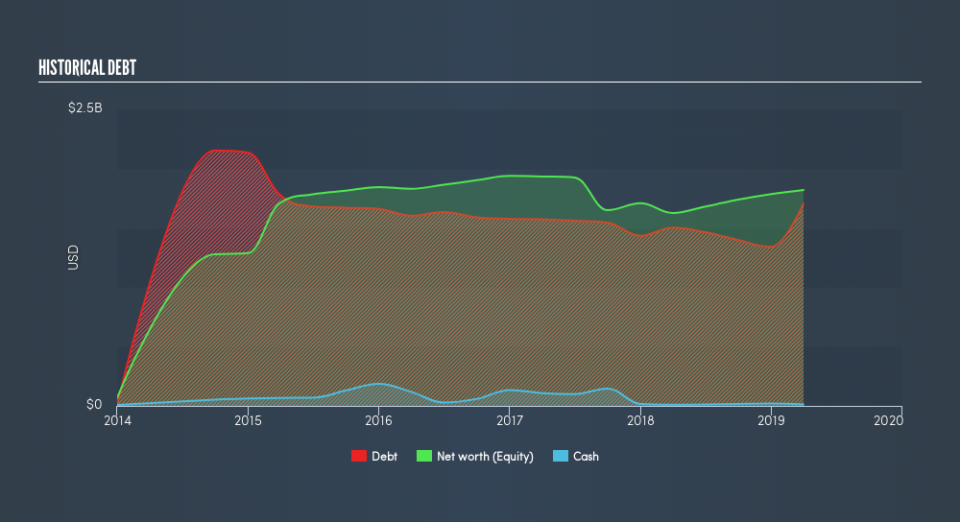
Does BKI Produce Much Cash Relative To Its Debt?
BKI has built up its total debt levels in the last twelve months, from US$1.5b to US$1.7b , which includes long-term debt. With this rise in debt, the current cash and short-term investment levels stands at US$12m , ready to be used for running the business. Moreover, BKI has generated US$401m in operating cash flow during the same period of time, leading to an operating cash to total debt ratio of 23%, signalling that BKI’s debt is appropriately covered by operating cash.
Does BKI’s liquid assets cover its short-term commitments?
With current liabilities at US$212m, it seems that the business has been able to meet these obligations given the level of current assets of US$262m, with a current ratio of 1.24x. The current ratio is calculated by dividing current assets by current liabilities. Usually, for IT companies, this is a suitable ratio as there's enough of a cash buffer without holding too much capital in low return investments.
Can BKI service its debt comfortably?
With debt reaching 94% of equity, BKI may be thought of as relatively highly levered. This is not uncommon for a mid-cap company given that debt tends to be lower-cost and at times, more accessible. We can test if BKI’s debt levels are sustainable by measuring interest payments against earnings of a company. Ideally, earnings before interest and tax (EBIT) should cover net interest by at least three times. For BKI, the ratio of 5.01x suggests that interest is appropriately covered, which means that debtors may be willing to loan the company more money, giving BKI ample headroom to grow its debt facilities.
Next Steps:
BKI’s high cash coverage means that, although its debt levels are high, the company is able to utilise its borrowings efficiently in order to generate cash flow. This may mean this is an optimal capital structure for the business, given that it is also meeting its short-term commitment. Keep in mind I haven't considered other factors such as how BKI has been performing in the past. I suggest you continue to research Black Knight to get a better picture of the mid-cap by looking at:
Future Outlook: What are well-informed industry analysts predicting for BKI’s future growth? Take a look at our free research report of analyst consensus for BKI’s outlook.
Valuation: What is BKI worth today? Is the stock undervalued, even when its growth outlook is factored into its intrinsic value? The intrinsic value infographic in our free research report helps visualize whether BKI is currently mispriced by the market.
Other High-Performing Stocks: Are there other stocks that provide better prospects with proven track records? Explore our free list of these great stocks here.
We aim to bring you long-term focused research analysis driven by fundamental data. Note that our analysis may not factor in the latest price-sensitive company announcements or qualitative material.
If you spot an error that warrants correction, please contact the editor at editorial-team@simplywallst.com. This article by Simply Wall St is general in nature. It does not constitute a recommendation to buy or sell any stock, and does not take account of your objectives, or your financial situation. Simply Wall St has no position in the stocks mentioned. Thank you for reading.
