
 Yahoo Finance
 What You Must Know About BRC Asia Limited’s (SGX:BEC) 2.02% ROE

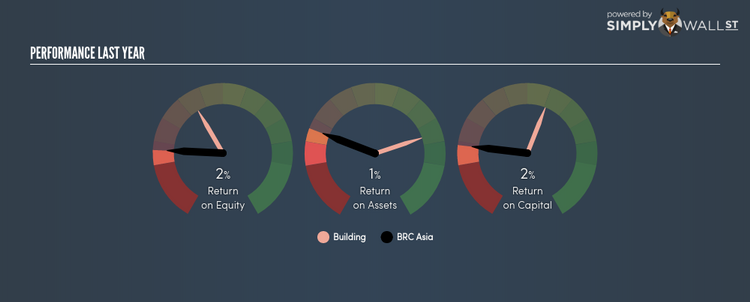
BRC Asia Limited (SGX:BEC) delivered a less impressive 2.02% ROE over the past year, compared to the 11.72% return generated by its industry. BEC’s results could indicate a relatively inefficient operation to its peers, and while this may be the case, it is important to understand what ROE is made up of and how it should be interpreted. Knowing these components could change your view on BEC’s performance. Metrics such as financial leverage can impact the level of ROE which in turn can affect the sustainability of BEC’s returns. Let me show you what I mean by this. Check out our latest analysis for BRC Asia
What you must know about ROE
Return on Equity (ROE) weighs BRC Asia’s profit against the level of its shareholders’ equity. For example, if the company invests SGD1 in the form of equity, it will generate SGD0.02 in earnings from this. In most cases, a higher ROE is preferred; however, there are many other factors we must consider prior to making any investment decisions.
Return on Equity = Net Profit ÷ Shareholders Equity
ROE is measured against cost of equity in order to determine the efficiency of BRC Asia’s equity capital deployed. Its cost of equity is 8.51%. Given a discrepancy of -6.49% between return and cost, this indicated that BRC Asia may be paying more for its capital than what it’s generating in return. ROE can be dissected into three distinct ratios: net profit margin, asset turnover, and financial leverage. This is called the Dupont Formula:
Dupont Formula
ROE = profit margin × asset turnover × financial leverage
ROE = (annual net profit ÷ sales) × (sales ÷ assets) × (assets ÷ shareholders’ equity)
ROE = annual net profit ÷ shareholders’ equity
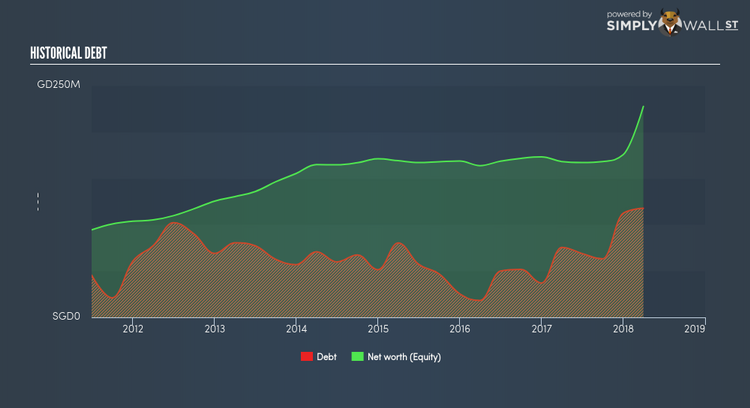
Basically, profit margin measures how much of revenue trickles down into earnings which illustrates how efficient the business is with its cost management. The other component, asset turnover, illustrates how much revenue BRC Asia can make from its asset base. The most interesting ratio, and reflective of sustainability of its ROE, is financial leverage. Since financial leverage can artificially inflate ROE, we need to look at how much debt BRC Asia currently has. The debt-to-equity ratio currently stands at a sensible 51.69%, meaning the ROE is a result of its capacity to produce profit growth without a huge debt burden.
Next Steps:
While ROE is a relatively simple calculation, it can be broken down into different ratios, each telling a different story about the strengths and weaknesses of a company. BRC Asia exhibits a weak ROE against its peers, as well as insufficient levels to cover its own cost of equity this year. However, ROE is not likely to be inflated by excessive debt funding, giving shareholders more conviction in the sustainability of returns, which has headroom to increase further. ROE is a helpful signal, but it is definitely not sufficient on its own to make an investment decision.
For BRC Asia, there are three important aspects you should look at:
Financial Health: Does it have a healthy balance sheet? Take a look at our free balance sheet analysis with six simple checks on key factors like leverage and risk.
Future Earnings: How does BRC Asia’s growth rate compare to its peers and the wider market? Dig deeper into the analyst consensus number for the upcoming years by interacting with our free analyst growth expectation chart.
Other High-Growth Alternatives : Are there other high-growth stocks you could be holding instead of BRC Asia? Explore our interactive list of stocks with large growth potential to get an idea of what else is out there you may be missing!
To help readers see pass the short term volatility of the financial market, we aim to bring you a long-term focused research analysis purely driven by fundamental data. Note that our analysis does not factor in the latest price sensitive company announcements.
The author is an independent contributor and at the time of publication had no position in the stocks mentioned.
