
 Yahoo Finance
 What You Must Know About CNT Group Limited’s (HKG:701) Beta Value

Anyone researching CNT Group Limited (HKG:701) might want to consider the historical volatility of the share price. Volatility is considered to be a measure of risk in modern finance theory. Investors may think of volatility as falling into two main categories. The first category is company specific volatility. This can be dealt with by limiting your exposure to any particular stock. The other type, which cannot be diversified away, is the volatility of the entire market. Every stock in the market is exposed to this volatility, which is linked to the fact that stocks prices are correlated in an efficient market.
Some stocks are more sensitive to general market forces than others. Beta is a widely used metric to measure a stock’s exposure to market risk (volatility). Before we go on, it’s worth noting that Warren Buffett pointed out in his 2014 letter to shareholders that ‘volatility is far from synonymous with risk.’ Having said that, beta can still be rather useful. The first thing to understand about beta is that the beta of the overall market is one. A stock with a beta below one is either less volatile than the market, or more volatile but not corellated with the overall market. In comparison a stock with a beta of over one tends to be move in a similar direction to the market in the long term, but with greater changes in price.
See our latest analysis for CNT Group
What does 701’s beta value mean to investors?
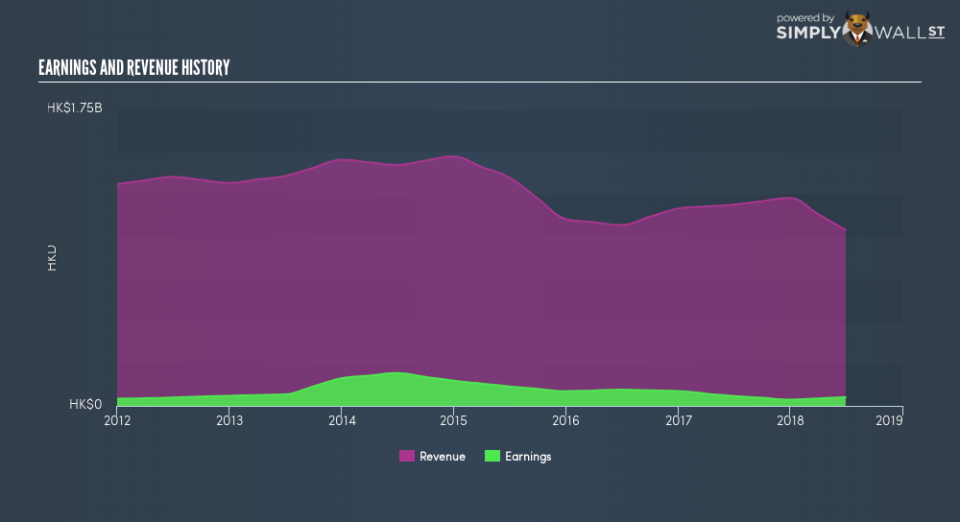
Zooming in on CNT Group, we see it has a five year beta of 1.3. This is above 1, so historically its share price has been influenced by the broader volatility of the stock market the market. If this beta value holds true in the future, CNT Group shares are likely to rise more than the market when the market is going up, but fall faster when the market is going down. Share price volatility is well worth considering, but most long term investors consider the history of revenue and earnings growth to be more important. Take a look at how CNT Group fares in that regard, below.
Could 701’s size cause it to be more volatile?
CNT Group is a noticeably small company, with a market capitalisation of HK$723m. Most companies this size are not always actively traded. It has a relatively high beta, suggesting it is fairly actively traded for a company of its size. Because it takes less capital to move the share price of a small company like this, when a stock this size is actively traded it is quite often more sensitive to market volatility than similar large companies.
What this means for you:
Since CNT Group tends to moves up when the market is going up, and down when it’s going down, potential investors may wish to reflect on the overall market, when considering the stock. This article aims to educate investors about beta values, but it’s well worth looking at important company-specific fundamentals such as CNT Group’s financial health and performance track record. I urge you to continue your research by taking a look at the following:
Future Outlook: What are well-informed industry analysts predicting for 701’s future growth? Take a look at our free research report of analyst consensus for 701’s outlook.
Past Track Record: Has 701 been consistently performing well irrespective of the ups and downs in the market? Go into more detail in the past performance analysis and take a look at the free visual representations of 701’s historicals for more clarity.
Other Interesting Stocks: It’s worth checking to see how 701 measures up against other companies on valuation. You could start with this free list of prospective options.
To help readers see past the short term volatility of the financial market, we aim to bring you a long-term focused research analysis purely driven by fundamental data. Note that our analysis does not factor in the latest price-sensitive company announcements.
The author is an independent contributor and at the time of publication had no position in the stocks mentioned. For errors that warrant correction please contact the editor at editorial-team@simplywallst.com.
