
 Yahoo Finance
 What You Must Know About Cobham plc’s (LON:COB) Financial Health

Stocks with market capitalization between $2B and $10B, such as Cobham plc (LON:COB) with a size of UK£2.8b, do not attract as much attention from the investing community as do the small-caps and large-caps. Despite this, commonly overlooked mid-caps have historically produced better risk-adjusted returns than their small and large-cap counterparts. Today we will look at COB’s financial liquidity and debt levels, which are strong indicators for whether the company can weather economic downturns or fund strategic acquisitions for future growth. Note that this commentary is very high-level and solely focused on financial health, so I suggest you dig deeper yourself into COB here.
View our latest analysis for Cobham
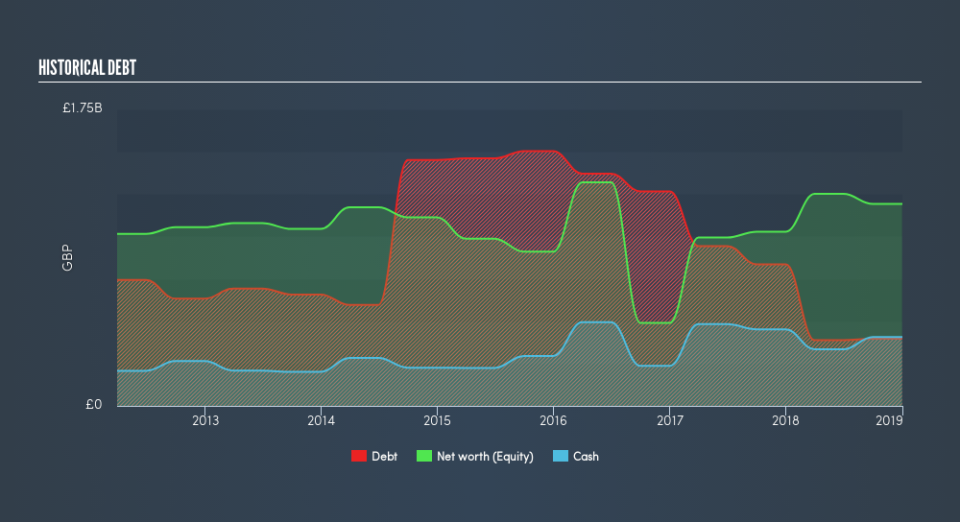
COB’s Debt (And Cash Flows)
Over the past year, COB has reduced its debt from UK£835m to UK£397m , which includes long-term debt. With this debt repayment, the current cash and short-term investment levels stands at UK£407m , ready to be used for running the business. On top of this, COB has produced UK£125m in operating cash flow in the last twelve months, resulting in an operating cash to total debt ratio of 32%, indicating that COB’s current level of operating cash is high enough to cover debt.
Can COB meet its short-term obligations with the cash in hand?
With current liabilities at UK£862m, it seems that the business has been able to meet these obligations given the level of current assets of UK£1.1b, with a current ratio of 1.33x. The current ratio is the number you get when you divide current assets by current liabilities. Usually, for Aerospace & Defense companies, this is a suitable ratio as there’s enough of a cash buffer without holding too much capital in low return investments.
Can COB service its debt comfortably?
With debt at 33% of equity, COB may be thought of as appropriately levered. COB is not taking on too much debt commitment, which can be restrictive and risky for equity-holders. We can test if COB’s debt levels are sustainable by measuring interest payments against earnings of a company. Ideally, earnings before interest and tax (EBIT) should cover net interest by at least three times. For COB, the ratio of 4.33x suggests that interest is appropriately covered, which means that lenders may be inclined to lend more money to the company, as it is seen as safe in terms of payback.
Next Steps:
COB has demonstrated its ability to generate sufficient levels of cash flow, while its debt hovers at an appropriate level. In addition to this, the company exhibits an ability to meet its near term obligations should an adverse event occur. I admit this is a fairly basic analysis for COB’s financial health. Other important fundamentals need to be considered alongside. You should continue to research Cobham to get a more holistic view of the stock by looking at:
Future Outlook: What are well-informed industry analysts predicting for COB’s future growth? Take a look at our free research report of analyst consensus for COB’s outlook.
Valuation: What is COB worth today? Is the stock undervalued, even when its growth outlook is factored into its intrinsic value? The intrinsic value infographic in our free research report helps visualize whether COB is currently mispriced by the market.
Other High-Performing Stocks: Are there other stocks that provide better prospects with proven track records? Explore our free list of these great stocks here.
We aim to bring you long-term focused research analysis driven by fundamental data. Note that our analysis may not factor in the latest price-sensitive company announcements or qualitative material.
If you spot an error that warrants correction, please contact the editor at editorial-team@simplywallst.com. This article by Simply Wall St is general in nature. It does not constitute a recommendation to buy or sell any stock, and does not take account of your objectives, or your financial situation. Simply Wall St has no position in the stocks mentioned. Thank you for reading.
