
 Yahoo Finance
 What You Must Know About EQTEC plc’s (LON:EQT) Financial Strength

While small-cap stocks, such as EQTEC plc (AIM:EQT) with its market cap of UK£11.72M, are popular for their explosive growth, investors should also be aware of their balance sheet to judge whether the company can survive a downturn. Given that EQT is not presently profitable, it’s crucial to evaluate the current state of its operations and pathway to profitability. Here are few basic financial health checks you should consider before taking the plunge. Though, given that I have not delve into the company-specifics, I recommend you dig deeper yourself into EQT here.
Does EQT generate an acceptable amount of cash through operations?
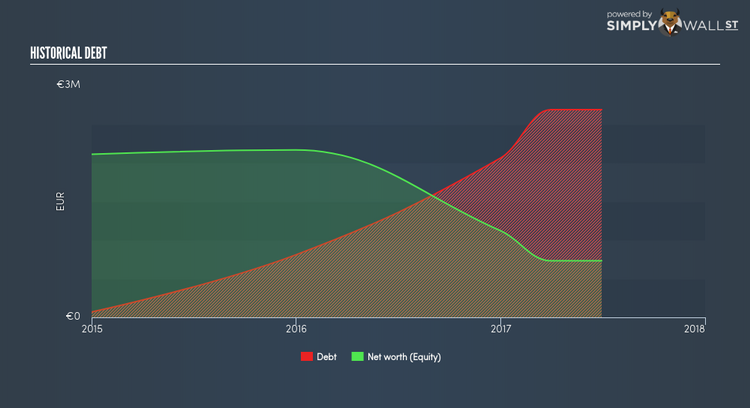
EQT has built up its total debt levels in the last twelve months, from €810.00K to €2.06M , which comprises of short- and long-term debt. With this rise in debt, the current cash and short-term investment levels stands at €113.00K , ready to deploy into the business. Moving onto cash from operations, its small level of operating cash flow means calculating cash-to-debt wouldn’t be too useful, though these low levels of cash means that operational efficiency is worth a look. As the purpose of this article is a high-level overview, I won’t be looking at this today, but you can take a look at some of EQT’s operating efficiency ratios such as ROA here.
Can EQT pay its short-term liabilities?
Looking at EQT’s most recent €2.57M liabilities, the company has not maintained a sufficient level of current assets to meet its obligations, with the current ratio last standing at 0.97x, which is below the prudent industry ratio of 3x.
Does EQT face the risk of succumbing to its debt-load?
With total debt exceeding equities, EQT is considered a highly levered company. This is not uncommon for a small-cap company given that debt tends to be lower-cost and at times, more accessible. Though, since EQT is presently loss-making, there’s a question of sustainability of its current operations. Maintaining a high level of debt, while revenues are still below costs, can be dangerous as liquidity tends to dry up in unexpected downturns.
Next Steps:
EQT’s high debt levels is not met with high cash flow coverage. This leaves room for improvement in terms of debt management and operational efficiency. In addition to this, its lack of liquidity raises questions over current asset management practices for the small-cap. This is only a rough assessment of financial health, and I’m sure EQT has company-specific issues impacting its capital structure decisions. You should continue to research EQTEC to get a better picture of the stock by looking at:
Historical Performance: What has EQT’s returns been like over the past? Go into more detail in the past track record analysis and take a look at the free visual representations of our analysis for more clarity.
Other High-Performing Stocks: Are there other stocks that provide better prospects with proven track records? Explore our free list of these great stocks here.
To help readers see pass the short term volatility of the financial market, we aim to bring you a long-term focused research analysis purely driven by fundamental data. Note that our analysis does not factor in the latest price sensitive company announcements.
The author is an independent contributor and at the time of publication had no position in the stocks mentioned.
