
 Yahoo Finance
 What You Must Know About FullSix SpA’s (BIT:FUL) Financial Strength

FullSix SpA (BIT:FUL) is a small-cap stock with a market capitalization of €9.6m. While investors primarily focus on the growth potential and competitive landscape of the small-cap companies, they end up ignoring a key aspect, which could be the biggest threat to its existence: its financial health. Why is it important? Given that FUL is not presently profitable, it’s crucial to assess the current state of its operations and pathway to profitability. Here are few basic financial health checks you should consider before taking the plunge. Nevertheless, I know these factors are very high-level, so I recommend you dig deeper yourself into FUL here.
Does FUL produce enough cash relative to debt?
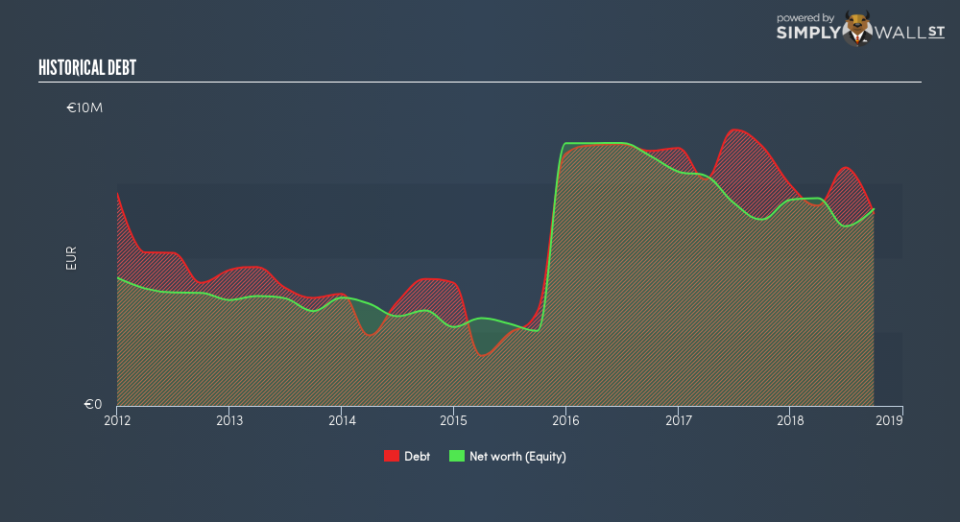
FUL has shrunken its total debt levels in the last twelve months, from €8.8m to €6.5m – this includes long-term debt. With this debt payback, the current cash and short-term investment levels stands at €386k for investing into the business. Moving onto cash from operations, its trivial cash flows from operations make the cash-to-debt ratio less useful to us, though these low levels of cash means that operational efficiency is worth a look. For this article’s sake, I won’t be looking at this today, but you can examine some of FUL’s operating efficiency ratios such as ROA here.
Can FUL meet its short-term obligations with the cash in hand?
At the current liabilities level of €14m, it seems that the business may not be able to easily meet these obligations given the level of current assets of €12m, with a current ratio of 0.85x.
Does FUL face the risk of succumbing to its debt-load?
With a debt-to-equity ratio of 98%, FUL can be considered as an above-average leveraged company. This is not uncommon for a small-cap company given that debt tends to be lower-cost and at times, more accessible. But since FUL is currently loss-making, sustainability of its current state of operations becomes a concern. Maintaining a high level of debt, while revenues are still below costs, can be dangerous as liquidity tends to dry up in unexpected downturns.
Next Steps:
Although FUL’s debt level is towards the higher end of the spectrum, its cash flow coverage seems adequate to meet debt obligations which means its debt is being efficiently utilised. But, its low liquidity raises concerns over whether current asset management practices are properly implemented for the small-cap. Keep in mind I haven’t considered other factors such as how FUL has been performing in the past. I suggest you continue to research FullSix to get a better picture of the stock by looking at:
Historical Performance: What has FUL’s returns been like over the past? Go into more detail in the past track record analysis and take a look at the free visual representations of our analysis for more clarity.
Other High-Performing Stocks: Are there other stocks that provide better prospects with proven track records? Explore our free list of these great stocks here.
To help readers see past the short term volatility of the financial market, we aim to bring you a long-term focused research analysis purely driven by fundamental data. Note that our analysis does not factor in the latest price-sensitive company announcements.
The author is an independent contributor and at the time of publication had no position in the stocks mentioned. For errors that warrant correction please contact the editor at editorial-team@simplywallst.com.
