
 Yahoo Finance
 What You Must Know About Hastings Group Holdings plc’s (LON:HSTG) ROE

This analysis is intended to introduce important early concepts to people who are starting to invest and looking to gauge the potential return on investment in Hastings Group Holdings plc (LON:HSTG).
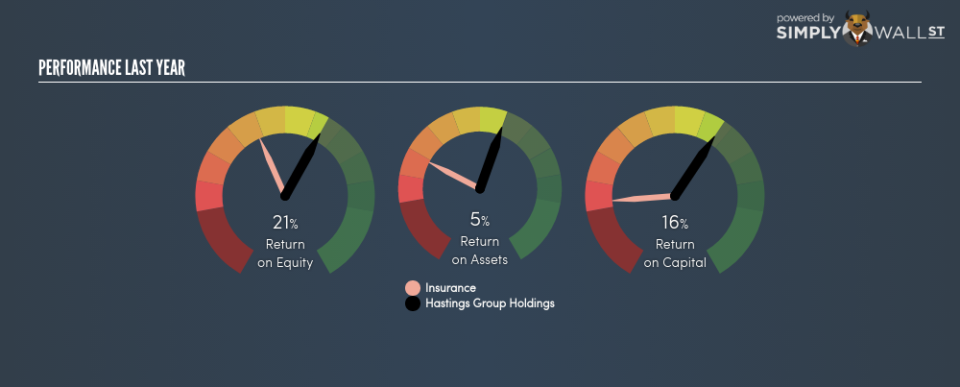
With an ROE of 20.67%, Hastings Group Holdings plc (LON:HSTG) outpaced its own industry which delivered a less exciting 12.19% over the past year. Superficially, this looks great since we know that HSTG has generated big profits with little equity capital; however, ROE doesn’t tell us how much HSTG has borrowed in debt. In this article, we’ll closely examine some factors like financial leverage to evaluate the sustainability of HSTG’s ROE. See our latest analysis for Hastings Group Holdings
What you must know about ROE
Firstly, Return on Equity, or ROE, is simply the percentage of last years’ earning against the book value of shareholders’ equity. For example, if the company invests £1 in the form of equity, it will generate £0.21 in earnings from this. Generally speaking, a higher ROE is preferred; however, there are other factors we must also consider before making any conclusions.
Return on Equity = Net Profit ÷ Shareholders Equity
Returns are usually compared to costs to measure the efficiency of capital. Hastings Group Holdings’s cost of equity is 8.28%. Given a positive discrepancy of 12.39% between return and cost, this indicates that Hastings Group Holdings pays less for its capital than what it generates in return, which is a sign of capital efficiency. ROE can be broken down into three different ratios: net profit margin, asset turnover, and financial leverage. This is called the Dupont Formula:
Dupont Formula
ROE = profit margin × asset turnover × financial leverage
ROE = (annual net profit ÷ sales) × (sales ÷ assets) × (assets ÷ shareholders’ equity)
ROE = annual net profit ÷ shareholders’ equity
Essentially, profit margin shows how much money the company makes after paying for all its expenses. Asset turnover reveals how much revenue can be generated from Hastings Group Holdings’s asset base. The most interesting ratio, and reflective of sustainability of its ROE, is financial leverage. Since ROE can be artificially increased through excessive borrowing, we should check Hastings Group Holdings’s historic debt-to-equity ratio. At 44.38%, Hastings Group Holdings’s debt-to-equity ratio appears low and indicates the above-average ROE is generated from its capacity to increase profit without a large debt burden.

Next Steps:
ROE is one of many ratios which meaningfully dissects financial statements, which illustrates the quality of a company. Hastings Group Holdings’s ROE is impressive relative to the industry average and also covers its cost of equity. ROE is not likely to be inflated by excessive debt funding, giving shareholders more conviction in the sustainability of high returns. ROE is a helpful signal, but it is definitely not sufficient on its own to make an investment decision.
For Hastings Group Holdings, I’ve compiled three pertinent factors you should look at:
Financial Health: Does it have a healthy balance sheet? Take a look at our free balance sheet analysis with six simple checks on key factors like leverage and risk.
Valuation: What is Hastings Group Holdings worth today? Is the stock undervalued, even when its growth outlook is factored into its intrinsic value? The intrinsic value infographic in our free research report helps visualize whether Hastings Group Holdings is currently mispriced by the market.
Other High-Growth Alternatives : Are there other high-growth stocks you could be holding instead of Hastings Group Holdings? Explore our interactive list of stocks with large growth potential to get an idea of what else is out there you may be missing!
To help readers see pass the short term volatility of the financial market, we aim to bring you a long-term focused research analysis purely driven by fundamental data. Note that our analysis does not factor in the latest price sensitive company announcements.
The author is an independent contributor and at the time of publication had no position in the stocks mentioned.
