
 Yahoo Finance
 What You Must Know About Johnson Matthey Plc’s (LON:JMAT) Financial Strength

Mid-caps stocks, like Johnson Matthey Plc (LON:JMAT) with a market capitalization of UK£5.4b, aren’t the focus of most investors who prefer to direct their investments towards either large-cap or small-cap stocks. However, generally ignored mid-caps have historically delivered better risk-adjusted returns than the two other categories of stocks. Let’s take a look at JMAT’s debt concentration and assess their financial liquidity to get an idea of their ability to fund strategic acquisitions and grow through cyclical pressures. Note that this information is centred entirely on financial health and is a top-level understanding, so I encourage you to look further into JMAT here.
View our latest analysis for Johnson Matthey
How does JMAT’s operating cash flow stack up against its debt?
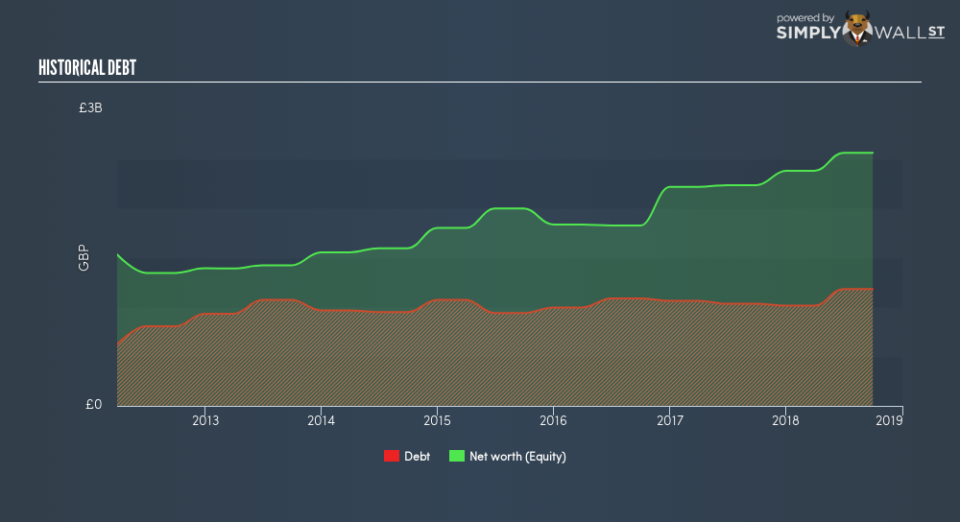
JMAT’s debt levels surged from UK£1.0b to UK£1.2b over the last 12 months , which accounts for long term debt. With this growth in debt, the current cash and short-term investment levels stands at UK£141m for investing into the business. Additionally, JMAT has produced UK£290m in operating cash flow during the same period of time, resulting in an operating cash to total debt ratio of 25%, signalling that JMAT’s operating cash is sufficient to cover its debt. This ratio can also be a sign of operational efficiency as an alternative to return on assets. In JMAT’s case, it is able to generate 0.25x cash from its debt capital.
Can JMAT meet its short-term obligations with the cash in hand?
At the current liabilities level of UK£1.3b, the company has been able to meet these commitments with a current assets level of UK£2.5b, leading to a 1.95x current account ratio. For Chemicals companies, this ratio is within a sensible range as there’s enough of a cash buffer without holding too much capital in low return investments.
Does JMAT face the risk of succumbing to its debt-load?
JMAT is a relatively highly levered company with a debt-to-equity of 46%. This is not uncommon for a mid-cap company given that debt tends to be lower-cost and at times, more accessible. We can check to see whether JMAT is able to meet its debt obligations by looking at the net interest coverage ratio. A company generating earnings before interest and tax (EBIT) at least three times its net interest payments is considered financially sound. In JMAT’s, case, the ratio of 13.92x suggests that interest is comfortably covered, which means that debtors may be willing to loan the company more money, giving JMAT ample headroom to grow its debt facilities.
Next Steps:
JMAT’s high cash coverage means that, although its debt levels are high, the company is able to utilise its borrowings efficiently in order to generate cash flow. This may mean this is an optimal capital structure for the business, given that it is also meeting its short-term commitment. This is only a rough assessment of financial health, and I’m sure JMAT has company-specific issues impacting its capital structure decisions. I suggest you continue to research Johnson Matthey to get a better picture of the mid-cap by looking at:
Future Outlook: What are well-informed industry analysts predicting for JMAT’s future growth? Take a look at our free research report of analyst consensus for JMAT’s outlook.
Valuation: What is JMAT worth today? Is the stock undervalued, even when its growth outlook is factored into its intrinsic value? The intrinsic value infographic in our free research report helps visualize whether JMAT is currently mispriced by the market.
Other High-Performing Stocks: Are there other stocks that provide better prospects with proven track records? Explore our free list of these great stocks here.
To help readers see past the short term volatility of the financial market, we aim to bring you a long-term focused research analysis purely driven by fundamental data. Note that our analysis does not factor in the latest price-sensitive company announcements.
The author is an independent contributor and at the time of publication had no position in the stocks mentioned. For errors that warrant correction please contact the editor at editorial-team@simplywallst.com.
