
 Yahoo Finance
 What You Must Know About Synthomer plc’s (LON:SYNT) Financial Strength

Synthomer plc (LON:SYNT) is a small-cap stock with a market capitalization of UK£1.4b. While investors primarily focus on the growth potential and competitive landscape of the small-cap companies, they end up ignoring a key aspect, which could be the biggest threat to its existence: its financial health. Why is it important? So, understanding the company’s financial health becomes crucial, since poor capital management may bring about bankruptcies, which occur at a higher rate for small-caps. Here are a few basic checks that are good enough to have a broad overview of the company’s financial strength. Nevertheless, given that I have not delve into the company-specifics, I’d encourage you to dig deeper yourself into SYNT here.
Does SYNT produce enough cash relative to debt?
SYNT has shrunken its total debt levels in the last twelve months, from UK£372m to UK£293m – this includes long-term debt. With this debt repayment, SYNT’s cash and short-term investments stands at UK£98m , ready to deploy into the business. On top of this, SYNT has produced UK£141m in operating cash flow over the same time period, resulting in an operating cash to total debt ratio of 48%, signalling that SYNT’s operating cash is sufficient to cover its debt. This ratio can also be a sign of operational efficiency as an alternative to return on assets. In SYNT’s case, it is able to generate 0.48x cash from its debt capital.
Does SYNT’s liquid assets cover its short-term commitments?
At the current liabilities level of UK£362m, it appears that the company has been able to meet these obligations given the level of current assets of UK£515m, with a current ratio of 1.42x. For Chemicals companies, this ratio is within a sensible range since there’s a sufficient cash cushion without leaving too much capital idle or in low-earning investments.
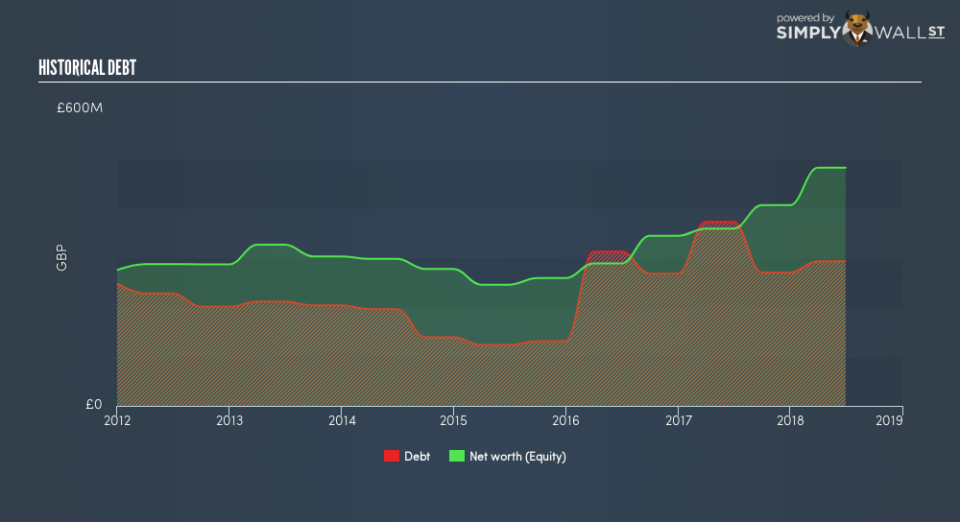
Is SYNT’s debt level acceptable?
With a debt-to-equity ratio of 61%, SYNT can be considered as an above-average leveraged company. This is not unusual for small-caps as debt tends to be a cheaper and faster source of funding for some businesses. No matter how high the company’s debt, if it can easily cover the interest payments, it’s considered to be efficient with its use of excess leverage. A company generating earnings after interest and tax at least three times its net interest payments is considered financially sound. In SYNT’s case, the ratio of 37.22x suggests that interest is comfortably covered, which means that debtors may be willing to loan the company more money, giving SYNT ample headroom to grow its debt facilities.
Next Steps:
SYNT’s high cash coverage means that, although its debt levels are high, the company is able to utilise its borrowings efficiently in order to generate cash flow. Since there is also no concerns around SYNT’s liquidity needs, this may be its optimal capital structure for the time being. I admit this is a fairly basic analysis for SYNT’s financial health. Other important fundamentals need to be considered alongside. I suggest you continue to research Synthomer to get a better picture of the small-cap by looking at:
Future Outlook: What are well-informed industry analysts predicting for SYNT’s future growth? Take a look at our free research report of analyst consensus for SYNT’s outlook.
Valuation: What is SYNT worth today? Is the stock undervalued, even when its growth outlook is factored into its intrinsic value? The intrinsic value infographic in our free research report helps visualize whether SYNT is currently mispriced by the market.
Other High-Performing Stocks: Are there other stocks that provide better prospects with proven track records? Explore our free list of these great stocks here.
To help readers see past the short term volatility of the financial market, we aim to bring you a long-term focused research analysis purely driven by fundamental data. Note that our analysis does not factor in the latest price-sensitive company announcements.
The author is an independent contributor and at the time of publication had no position in the stocks mentioned. For errors that warrant correction please contact the editor at editorial-team@simplywallst.com.
